Human Population - Michigan State University
advertisement

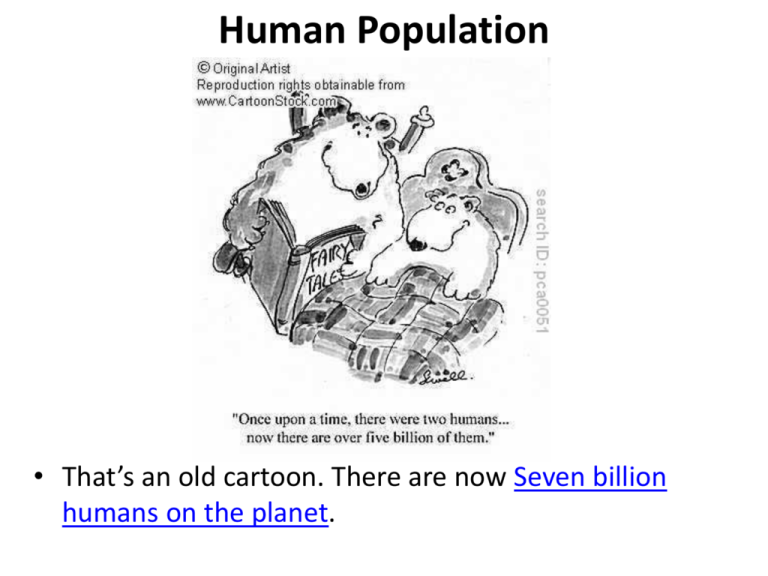
Human Population • That’s an old cartoon. There are now Seven billion humans on the planet. Demographics Terminology 1 • Demography is the study of populations—age structure, growth rate, etc. • Already defined—carrying capacity, logistic growth curve, species, and population. • Age structure is the composition of a population by age cohorts (percentage or number by age class). • Birth rate—births per 1000 (or 100,000) population per year. • Death rate—deaths per 1000 (or 100,000) population per year. • Growth rate—percentage increase in population per year. Demographics Terminology 2 • Life expectancy—average life time expected at birth. • Maximum lifetime—the maximum one can theoretically live. • Replacement fertility rate—the birthrate per woman over her lifetime to keep population constant (assuming no immigration or emigration). -- usually considered to be 2.1 in US. -- can be as high as 2.5 in countries with high mortality. • Population lag effect—responding to environmental conditions a generation later. • Zero population growth—a population’s births and deaths are balanced and births are at replacement rate (or lower). • Total fertility rate (TFR)--the average total number of children a woman will have over her lifetime. History of Human Population Human population throughout history of the species Age Structures Rapidly growing--a pyramid with a wide base. Slowly growing--a pyramid with a narrower base. Stable--a tower with a narrow base. Updated U.S. Age Structure Comparison between developed and developing countries (1975 purple; 2000 blue) Most of the population growth has been and will continue to be in the developing world. Global Fertility Rates 1993 Global Fertility Rates 2006 Future Population Growth Factors that have caused the human population to increase Decreased mortality from: Medicine: reducing death rates of diseased people. Public health: reducing the spread of disease to already healthy people. Law enforcement: reducing mortality from violence. Public safety: firefighters, lifeguards and others. Increased food supply and transportation (fossil fuel use), reducing famine -(increased carrying capacity). Public Health and Medicine Factors that did not contribute to population growth • Decreased mortality from war is not one of the factors—combat is more deadly, although other causes of mortality from war have decreased. • Neither is increased birth rate—birth rates have generally decreased while population has increased. Declining World Fertility Rates U.S. Fertility Rates ( last 90 yrs) Rule of 72 Methods of reducing the rate of population growth in a society Design government programs to reward population restraint and punish high reproductive rates: - Allow access to contraception. - Increase benefits to families with few children and reduce them for families for more. - Increase access to medicine and public health (long-term solution). - Increase access to education for women. - Decrease poverty. - Promote a technological society. Affluence and Fertility China’s One Child Policy NDTTV Video: China Won't Change One-Child Policy India’s Changing Age Structure Demographic Transition • Higher use of resources. -- land. I=PxAxT -- food. I = impact -- water. P = population -- minerals. -- energy. A = affluence T = technology • Greater production of waste. -- solid waste. How to decrease -- air pollution. the environmental -- water pollution. impact of human -- heat. activities? Technology can also decrease impact technology reduced the impact by 69 percent over what it would otherwise have been Technology can also decrease impact Cities as Systems Discovery News video: Cities Are Like Stars Urban Populations by Country Growth of Urban Populations by Region Growth of Cities Largest Slums Favela (slum) in Brazil Effects of Urbanization on Surface Water Effects of Urbanization on Climate Microclimate is a different local climate for a small locality that is different from the area around it. Urban heat island—cities warmer than surroundings, also less humid but with more precipitation. The Weather Channel Video: The Urban Heat Island Explained Another Weather Channel Video: Science Behind Urban Heat Sprawl: Standardized and Ugly NASA video: What Doesn't Stay in Vegas? Sprawl. Google Earth: Landsat Annual Timelapse 19842012 Effects of Sprawl Anti-Sprawl in Unexpected Places • Portland has the strictest anti-sprawl policies in the country. This graphic shows people there are watching “The End of Suburbia.” In few weeks, we will, too. Urban Decay in Detroit Empty area in Detroit the size of San Francisco. One way to downsize the city. Interconnected urban villages St. Cyril past and present Google Maps shows that the neighborhood is now completely empty. What to do with Detroit’s empty land? Adopt Urban Agriculture: The world headquarters of the charity Urban Farming is located in Detroit. Michigan State University is putting an extension and research facility in Detroit. Hantz Farms is trying to start commercial operations in Detroit. There is a proposal for a shrimp raising facility in town. Hey, it beats a zombie theme park! How can cities be made more sustainable? Shifting people out of cars and into other modes of transportation (bikes, rail and buses). Limits and Regulations * Zoning * Planning * Protection * Taxes * Tax Breaks * Revitalization and New Growth. Metro Detroit and Public Transit • It is very difficult to get to work (and school) in metro Detroit by public transportation. • While 99% of the jobs in Detroit proper can be reached by bus, only 56% of the jobs in the suburbs can be, and most of the jobs are in the suburbs. Los Angeles—Back to the Future Detroit—Back to the Future? Yes, Back to the Future Walkable Neighborhoods 1 A walkable community features a medium density mix of housing, stores, business, schools, and destinations to walk to. It has paths, trails and sidewalks that connect neighborhoods to one another. In addition, walkable communities, are attractive, invite further exploration and are places where all people feel safe. Walkable Neighborhoods 2 Walkable Neighborhoods 3 Finally, there’s the hipster view of cities Human Population The Student Outcomes Assessment Committee is happy to announce the launch of the 7th annual student essay competition. Financially supported by the OCC Foundation the contest offers a total of $3,250 in prize money. Students have until Monday, March 3, 2014 to submit their essay. The prompt along with complete contest rules can be found at www.oaklandcc.edu/essay. Students can also pick up a Student Essay Packet at the Reference Desk at any OCC Library.


