3 - Cost Analysis
advertisement
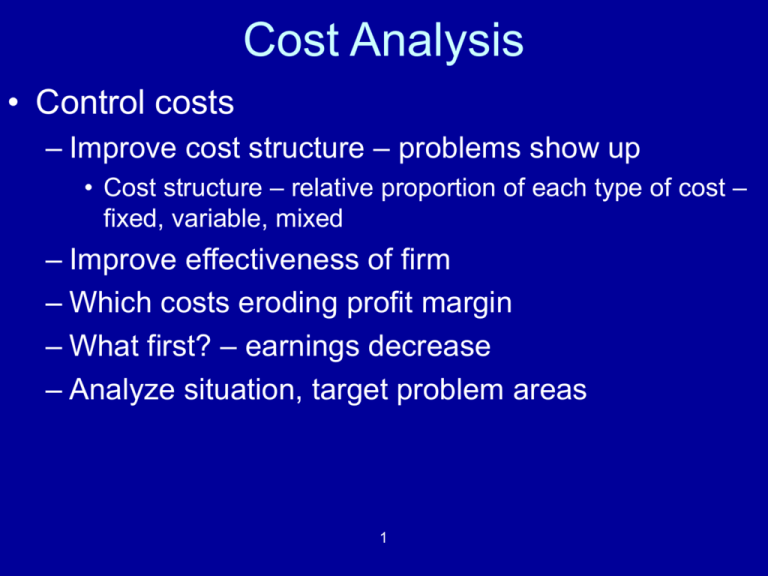
Cost Analysis • Control costs – Improve cost structure – problems show up • Cost structure – relative proportion of each type of cost – fixed, variable, mixed – Improve effectiveness of firm – Which costs eroding profit margin – What first? – earnings decrease – Analyze situation, target problem areas 1 – Cost behavior – • Fixed – remain constant – i.e. equipment • Variable – dollar amount varies in direct proportion to changes in activity level – i.e. Battery in car • Mixed – contains both variable and fixed elements – license fee of $25,000/year and $3/dinner party • Stepped costs – variable but increases in big chunks – i.e. Wages of maintenance workers 2 • Make sure that costing done correctly, reduce costs • Standard costing – assigning overhead costs based upon one predetermined rate based on volume • Activity based costing - designed to provide managers with cost information for strategic and other decisions that potentially affect capacity and therefore affect fixed as well as variable costs. – Most organizations maintain two costing systems – internal – most useful information. – Uses drivers at various levels 3 4 5 Annual Overhead Costs (both Manufacturing and Nonmanufacturing) Production Department: Indirect factory wages ...................... Factory equipment depreciation ........ Factory utilities................................. Factory building lease ....................... $500,000 300,000 120,000 80,000 $1,000,000 Shipping costs* .................................... 40,000 General Administrative Department: Administrative wages and salaries ..... Office equipment depreciation........... Administrative building lease............. 400,000 50,000 60,000 510,000 Marketing Department: Marketing wages and salaries ........... Selling expenses............................... 250,000 50,000 300,000 Total overhead cost .............................. 6 $1,850,000 Standard Stanchions Sales $13,600 Cost: Direct materials .............................. $ 2,110 Direct labor .................................... 1,850 Manufacturing overhead.................. 10,000 13,960 Product margin*................................ $ (360) Product Profitability Analysis Custom Compass Housing $650 $ 13 50 200 Standard Stanchions 263 $387 Custom Compass Housing Sales $13,600 $ 650 Costs: Direct materials ....................................$2,110 $ 13 Direct labor .......................................... 1,850 50 Shipping costs ...................................... 180 25 Customer orders................................... 630 315 Product design ..................................... 0 1,285 Order size ............................................ 3,800 8,570 76 1,764 7 Product margin..................................... $ 5,030 $(1,114) Activity Based Costing • Two stage allocation process – Assign costs to pools, then assign to products using cost drivers • I.e. Sell 50,000 CD units, 200,000 tape units = 250,000 units total – Both require two direct labor hours to complete = 500,000 direct labor-hours – Total manufacturing overhead = $10,000,000 8 Traditional Costing Method Direct Costs: Direct Materials Direct labor @ $10/hr Manufacturing overhead Total Unit cost $ $ $ $ CD 90.00 20.00 40.00 150.00 $ $ $ $ Tape 50.00 20.00 40.00 110.00 Total manufacturing overhead $ 10,000,000 Traditional method if apply with direct labor hours 10,000,000/500,000= $ 20.00 per unit per direct labor hour 2 hours per unit * $20 = $40/unit OH 9 ABC Costing Activity Center and Costs Labor related (labor hours) Machine related (machine hours) Machine setups (# of setups) Production orders (# orders) Material receipts (# of receipts) Parts admin ( part types) Product testing (# of tests) General overhead (machine hours) Total Expected activity Total Costs $800,000 $2,100,000 $1,600,000 $450,000 $1,000,000 $350,000 $1,700,000 $2,000,000 $10,000,000 10 500,000 1,000,000 4,000 1,200 5,000 700 20,000 1,000,000 CD 100,000 300,000 3,000 400 1,800 400 16,000 300,000 Cost Driver Tape 400,000 700,000 1,000 800 3,200 300 4,000 700,000 Estimated Total Expected Overhead Overhead Costs Activity Rate Labor related Machine related Machine setups Production orders Material receipts Parts administration Product testing General Factory $800,000 500,000 $2,100,000 1,000,000 $1,600,000 4,000 $450,000 1,200 $1,000,000 5,000 $350,000 700 $1,700,000 20,000 $2,000,000 1,000,000 CD Units Labor related Machine related Machine setups Production orders Material receipts Parts administration Product testing General Factory Rate * activity Total Units produced $1.60 $2.10 $400.00 $375.00 $200.00 $500.00 $85.00 $2.00 Tape Units $160,000 $630,000 $1,200,000 $150,000 $360,000 $200,000 $1,360,000 $600,000 $640,000 $1,470,000 $400,000 $300,000 $640,000 $150,000 $340,000 $1,400,000 $4,660,000 $5,340,000 50,000 200,000 11 Overhead per unit $93.20 $26.70 • Full capacity – constrained resource? – Constraint – limited resource that could restrict company’s ability to satisfy demand – how used – Theory of constraints – Should not necessarily promote products with highest CM but rather promote the product with the highest contribution margin per unit of constrained resource Theory of Constraints Example Sales Price Var. Cost Margin Time Contribution A $10.00 $5.00 $5.00 B $5.00 $3.00 $2.00 2 hrs .5 hrs $2.50 $4.00 12 C $15.00 $12.00 $3.00 1.5 hrs $2.00 – Value chain analysis – major business functions that add value to product and/or service • Eliminate or minimize non-value activities • Value-added activities – efficient as possible – Design in quality – reduce rework or scrap – Costs of quality • Prevention costs – plan the process to ensure that defects do not occur • Appraisal costs – measure the level of quality to insure customer requirements • Internal failure costs – rectify defective output before reaches customer • External failure costs – costs associated with delivering defective output to customer 13 • Effectiveness ratios – Inventory turnover = COGS/average inventory – how frequently sells inventory – JIT inventory system • • • • Lower costs by long-term contracts Closer relationship w/suppliers – guarantee deliver Reduce scrap by increasing quality Obsolete inventory on hand? – A/R turnover – Credit sales/average accounts receivable – ability to collect cash from credit customers • What is working? – Reduce operating cycle – need less working capital – invest in more productive activities 14 • Gross margin covers all costs - customers – 80/20 rule – 80% of headaches come from 20% of customers – how to find them? – Customer profitability – no problems – Find all costs – product fulfillment cycle – Some customers require extra work • Extra sales calls, customer service, smaller transportation lots, smaller orders – all add to costs – Expend effort on customers that are most profitable – Drop services that don’t increase goodwill or profitable 15 • Operating leverage – increase profitability – Multiplying force – how sensitive is net operating income to percentage change in sales, if high a small percentage increase in sales can produce a much larger percentage increase in net operating income – Mix of fixed versus variable costs – Capital intensive vs. labor intensive – Leverage multiplier - CM/NI 16 OPERATING LEVERAGE Operating leverage measures how a given percentage change in sales affects net operating income. Contribution margin Degree of = operating leverage Net operating income Sales .................................... Less variable expenses .......... Contribution margin............... Less fixed expenses ............... Net operating income ............ Degree of operating leverage . Company X $500,000 100% 350,000 70 150,000 30% 90,000 $ 60,000 2.5 Company Y $500,000 100% 100,000 20 400,000 80% 340,000 $ 60,000 6.7 If the degree of operating leverage is 2.5, then a 10% increase in sales should result in a 25% (= 2.5 × 10%) increase in net operating income. EXAMPLE: Assume that both company X and company Y experience a 10% increase in sales: Company X Sales ........................................ $550,000 100% Less variable expenses .............. 385,000 70 Contribution margin................... 165,000 30% Less fixed expenses ................... 90,000 17 Net operating income ................ $ 75,000 Increase in net operating income 25% Company Y $550,000 100% 110,000 20 440,000 80% 340,000 $100,000 67% • Download – Capital budgeting spreadsheet – Theory of constraints – Capital budgeting problems • Read Introduction to ABC Costing • Read internal control process • Read Survey Masters LLC • Assign #3 – ABC Costing/unit problem (due 2/2) • Assign #4 – profitability ratios (due 2/2) – Gross margin % - 07-05 – Profit margin – 07-05 – Return on Assets – 07-05 18 – Return on Equity - 07-05
