Project 1
advertisement
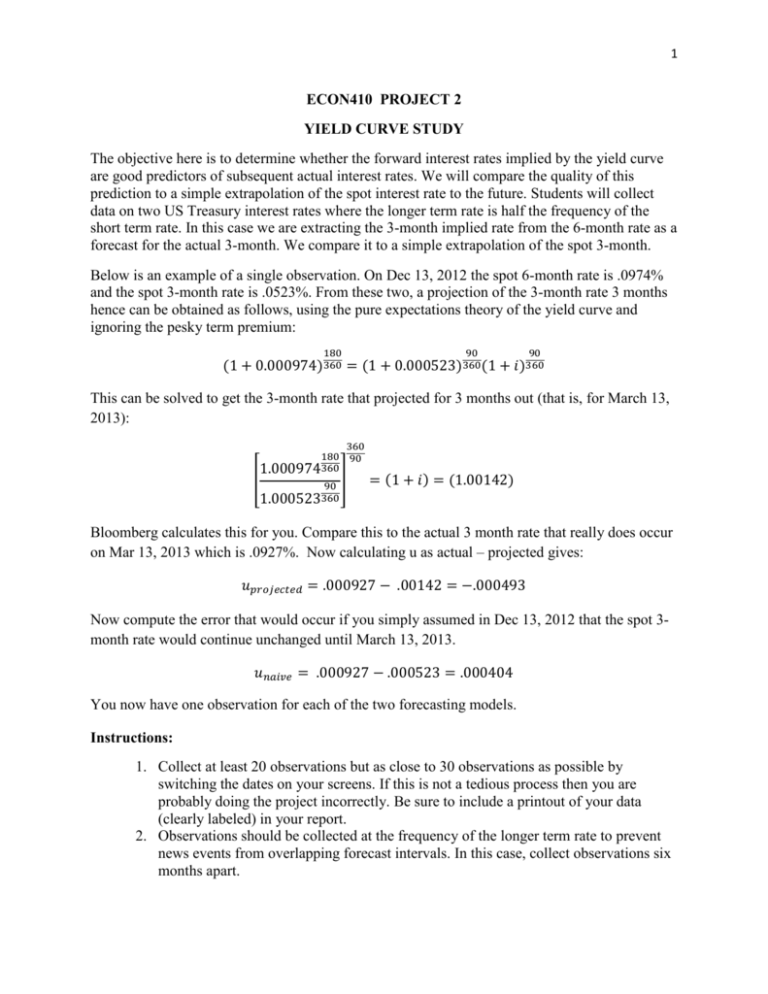
1 ECON410 PROJECT 2 YIELD CURVE STUDY The objective here is to determine whether the forward interest rates implied by the yield curve are good predictors of subsequent actual interest rates. We will compare the quality of this prediction to a simple extrapolation of the spot interest rate to the future. Students will collect data on two US Treasury interest rates where the longer term rate is half the frequency of the short term rate. In this case we are extracting the 3-month implied rate from the 6-month rate as a forecast for the actual 3-month. We compare it to a simple extrapolation of the spot 3-month. Below is an example of a single observation. On Dec 13, 2012 the spot 6-month rate is .0974% and the spot 3-month rate is .0523%. From these two, a projection of the 3-month rate 3 months hence can be obtained as follows, using the pure expectations theory of the yield curve and ignoring the pesky term premium: 180 90 90 (1 + 0.000974)360 = (1 + 0.000523)360 (1 + 𝑖)360 This can be solved to get the 3-month rate that projected for 3 months out (that is, for March 13, 2013): [ 360 180 90 1.000974360 90 ] 1.000523360 = (1 + 𝑖) = (1.00142) Bloomberg calculates this for you. Compare this to the actual 3 month rate that really does occur on Mar 13, 2013 which is .0927%. Now calculating u as actual – projected gives: 𝑢𝑝𝑟𝑜𝑗𝑒𝑐𝑡𝑒𝑑 = .000927 − .00142 = −.000493 Now compute the error that would occur if you simply assumed in Dec 13, 2012 that the spot 3month rate would continue unchanged until March 13, 2013. 𝑢𝑛𝑎𝑖𝑣𝑒 = .000927 − .000523 = .000404 You now have one observation for each of the two forecasting models. Instructions: 1. Collect at least 20 observations but as close to 30 observations as possible by switching the dates on your screens. If this is not a tedious process then you are probably doing the project incorrectly. Be sure to include a printout of your data (clearly labeled) in your report. 2. Observations should be collected at the frequency of the longer term rate to prevent news events from overlapping forecast intervals. In this case, collect observations six months apart. 2 3. The introductory section of your paper should explain theoretically how the implied forward rate is extracted. Using the pure expectations hypothesis, explain what the relationship between the implied forward interest rate and the actual interest rate is supposed to be. 4. The next section of your paper should describe your data, where you obtained it and how you manipulated it. 5. Calculate average uprojected and unaive and test whether they are significantly different from zero. Then calculate the correlation coefficient with its own lagged values, that is, corr(ut, ut-1). Test whether those are zero. Lastly, plot the data and visually inspect for patterns. Refer to Lecture 2 if you forget how to do these tests. 6. Calculate the mean absolute error (average of |u|) and the mean squared error (average of u2) for each model. Which is smaller? 7. The next paragraph should describe your results. Based on your results does either model generate unbiased forecasts? Based on the mean absolute error and the mean squared error which is the better forecast? Why are these superior measures to simple averages?
