48x36 Trifold Poster Template
advertisement
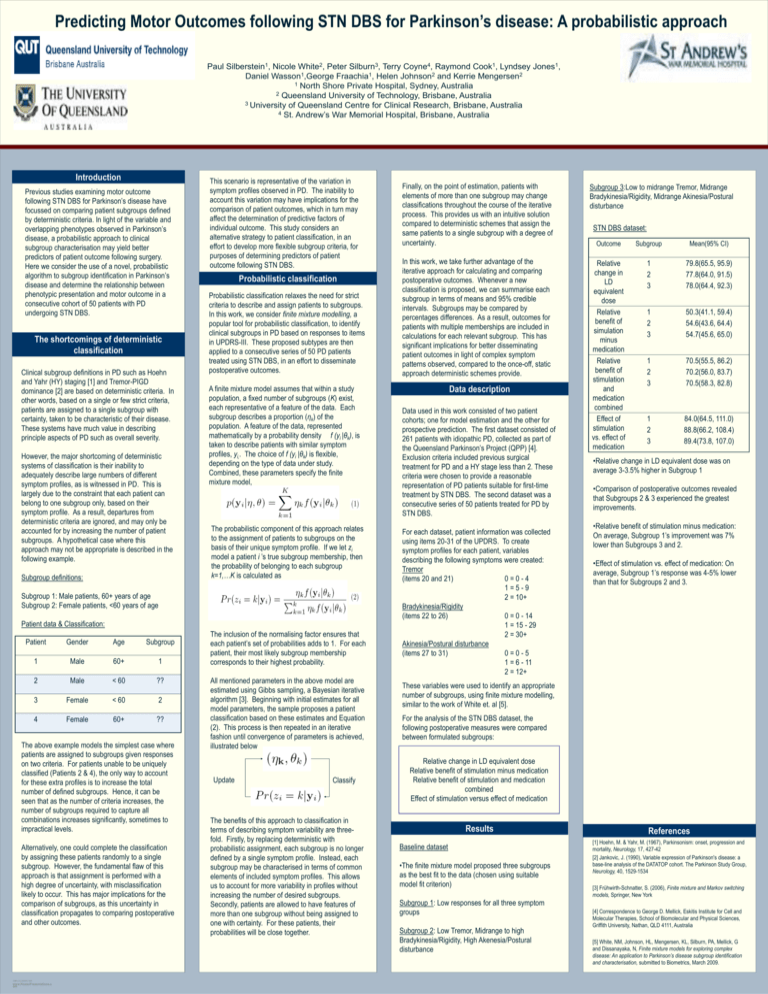
Predicting Motor Outcomes following STN DBS for Parkinson’s disease: A probabilistic approach Paul Silberstein1, Nicole White2, Peter Silburn3, Terry Coyne4, Raymond Cook1, Lyndsey Jones1, Daniel Wasson1,George Fraachia1, Helen Johnson2 and Kerrie Mengersen2 1 North Shore Private Hospital, Sydney, Australia 2 Queensland University of Technology, Brisbane, Australia 3 University of Queensland Centre for Clinical Research, Brisbane, Australia 4 St. Andrew’s War Memorial Hospital, Brisbane, Australia Introduction Previous studies examining motor outcome following STN DBS for Parkinson’s disease have focussed on comparing patient subgroups defined by deterministic criteria. In light of the variable and overlapping phenotypes observed in Parkinson’s disease, a probabilistic approach to clinical subgroup characterisation may yield better predictors of patient outcome following surgery. Here we consider the use of a novel, probabilistic algorithm to subgroup identification in Parkinson’s disease and determine the relationship between phenotypic presentation and motor outcome in a consecutive cohort of 50 patients with PD undergoing STN DBS. The shortcomings of deterministic classification Clinical subgroup definitions in PD such as Hoehn and Yahr (HY) staging [1] and Tremor-PIGD dominance [2] are based on deterministic criteria. In other words, based on a single or few strict criteria, patients are assigned to a single subgroup with certainty, taken to be characteristic of their disease. These systems have much value in describing principle aspects of PD such as overall severity. However, the major shortcoming of deterministic systems of classification is their inability to adequately describe large numbers of different symptom profiles, as is witnessed in PD. This is largely due to the constraint that each patient can belong to one subgroup only, based on their symptom profile. As a result, departures from deterministic criteria are ignored, and may only be accounted for by increasing the number of patient subgroups. A hypothetical case where this approach may not be appropriate is described in the following example. Subgroup definitions: This scenario is representative of the variation in symptom profiles observed in PD. The inability to account this variation may have implications for the comparison of patient outcomes, which in turn may affect the determination of predictive factors of individual outcome. This study considers an alternative strategy to patient classification, in an effort to develop more flexible subgroup criteria, for purposes of determining predictors of patient outcome following STN DBS. Probabilistic classification Probabilistic classification relaxes the need for strict criteria to describe and assign patients to subgroups. In this work, we consider finite mixture modelling, a popular tool for probabilistic classification, to identify clinical subgroups in PD based on responses to items in UPDRS-III. These proposed subtypes are then applied to a consecutive series of 50 PD patients treated using STN DBS, in an effort to disseminate postoperative outcomes. A finite mixture model assumes that within a study population, a fixed number of subgroups (K) exist, each representative of a feature of the data. Each subgroup describes a proportion (ηk) of the population. A feature of the data, represented mathematically by a probability density f (yi |θk), is taken to describe patients with similar symptom profiles, yi,. The choice of f (yi |θk) is flexible, depending on the type of data under study. Combined, these parameters specify the finite mixture model, The probabilistic component of this approach relates to the assignment of patients to subgroups on the basis of their unique symptom profile. If we let zi model a patient i ’s true subgroup membership, then the probability of belonging to each subgroup k=1,…K is calculated as Subgroup 1: Male patients, 60+ years of age Subgroup 2: Female patients, <60 years of age Patient data & Classification: Patient Gender Age Subgroup 1 Male 60+ 1 2 Male < 60 ?? 3 Female < 60 2 4 Female 60+ ?? The above example models the simplest case where patients are assigned to subgroups given responses on two criteria. For patients unable to be uniquely classified (Patients 2 & 4), the only way to account for these extra profiles is to increase the total number of defined subgroups. Hence, it can be seen that as the number of criteria increases, the number of subgroups required to capture all combinations increases significantly, sometimes to impractical levels. Alternatively, one could complete the classification by assigning these patients randomly to a single subgroup. However, the fundamental flaw of this approach is that assignment is performed with a high degree of uncertainty, with misclassification likely to occur. This has major implications for the comparison of subgroups, as this uncertainty in classification propagates to comparing postoperative and other outcomes. TEMPLATE DESIGN © 2008 www.PosterPresentations.c om The inclusion of the normalising factor ensures that each patient’s set of probabilities adds to 1. For each patient, their most likely subgroup membership corresponds to their highest probability. All mentioned parameters in the above model are estimated using Gibbs sampling, a Bayesian iterative algorithm [3]. Beginning with initial estimates for all model parameters, the sample proposes a patient classification based on these estimates and Equation (2). This process is then repeated in an iterative fashion until convergence of parameters is achieved, illustrated below Update Classify The benefits of this approach to classification in terms of describing symptom variability are threefold. Firstly, by replacing deterministic with probabilistic assignment, each subgroup is no longer defined by a single symptom profile. Instead, each subgroup may be characterised in terms of common elements of included symptom profiles. This allows us to account for more variability in profiles without increasing the number of desired subgroups. Secondly, patients are allowed to have features of more than one subgroup without being assigned to one with certainty. For these patients, their probabilities will be close together. Finally, on the point of estimation, patients with elements of more than one subgroup may change classifications throughout the course of the iterative process. This provides us with an intuitive solution compared to deterministic schemes that assign the same patients to a single subgroup with a degree of uncertainty. Subgroup 3:Low to midrange Tremor, Midrange Bradykinesia/Rigidity, Midrange Akinesia/Postural disturbance Outcome Subgroup Mean(95% CI) In this work, we take further advantage of the iterative approach for calculating and comparing postoperative outcomes. Whenever a new classification is proposed, we can summarise each subgroup in terms of means and 95% credible intervals. Subgroups may be compared by percentages differences. As a result, outcomes for patients with multiple memberships are included in calculations for each relevant subgroup. This has significant implications for better disseminating patient outcomes in light of complex symptom patterns observed, compared to the once-off, static approach deterministic schemes provide. Relative change in LD equivalent dose Relative benefit of simulation minus medication Relative benefit of stimulation and medication combined Effect of stimulation vs. effect of medication 1 2 3 79.8(65.5, 95.9) 77.8(64.0, 91.5) 78.0(64.4, 92.3) 1 2 3 50.3(41.1, 59.4) 54.6(43.6, 64.4) 54.7(45.6, 65.0) 1 2 3 70.5(55.5, 86.2) 70.2(56.0, 83.7) 70.5(58.3, 82.8) 1 2 3 84.0(64.5, 111.0) 88.8(66.2, 108.4) 89.4(73.8, 107.0) Data description Data used in this work consisted of two patient cohorts; one for model estimation and the other for prospective prediction. The first dataset consisted of 261 patients with idiopathic PD, collected as part of the Queensland Parkinson’s Project (QPP) [4]. Exclusion criteria included previous surgical treatment for PD and a HY stage less than 2. These criteria were chosen to provide a reasonable representation of PD patients suitable for first-time treatment by STN DBS. The second dataset was a consecutive series of 50 patients treated for PD by STN DBS. For each dataset, patient information was collected using items 20-31 of the UPDRS. To create symptom profiles for each patient, variables describing the following symptoms were created: Tremor (items 20 and 21) 0=0-4 1=5-9 2 = 10+ Bradykinesia/Rigidity (items 22 to 26) 0 = 0 - 14 1 = 15 - 29 2 = 30+ Akinesia/Postural disturbance (items 27 to 31) 0=0-5 1 = 6 - 11 2 = 12+ STN DBS dataset: •Relative change in LD equivalent dose was on average 3-3.5% higher in Subgroup 1 •Comparison of postoperative outcomes revealed that Subgroups 2 & 3 experienced the greatest improvements. •Relative benefit of stimulation minus medication: On average, Subgroup 1’s improvement was 7% lower than Subgroups 3 and 2. •Effect of stimulation vs. effect of medication: On average, Subgroup 1’s response was 4-5% lower than that for Subgroups 2 and 3. These variables were used to identify an appropriate number of subgroups, using finite mixture modelling, similar to the work of White et. al [5]. For the analysis of the STN DBS dataset, the following postoperative measures were compared between formulated subgroups: Relative change in LD equivalent dose Relative benefit of stimulation minus medication Relative benefit of stimulation and medication combined Effect of stimulation versus effect of medication Results Baseline dataset •The finite mixture model proposed three subgroups as the best fit to the data (chosen using suitable model fit criterion) Subgroup 1: Low responses for all three symptom groups Subgroup 2: Low Tremor, Midrange to high Bradykinesia/Rigidity, High Akenesia/Postural disturbance References [1] Hoehn, M. & Yahr, M. (1967), Parkinsonism: onset, progression and mortality, Neurology, 17, 427-42 [2] Jankovic, J. (1990), Variable expression of Parkinson's disease: a base-line analysis of the DATATOP cohort. The Parkinson Study Group, Neurology, 40, 1529-1534 [3] Frühwirth-Schnatter, S. (2006), Finite mixture and Markov switching models, Springer, New York [4] Correspondence to George D. Mellick, Eskitis Institute for Cell and Molecular Therapies, School of Biomolecular and Physical Sciences, Griffith University, Nathan, QLD 4111, Australia [5] White, NM, Johnson, HL, Mengersen, KL, Silburn, PA, Mellick, G and Dissanayaka, N, Finite mixture models for exploring complex disease: An application to Parkinson’s disease subgroup identification and characterisation, submitted to Biometrics, March 2009.


