A3 Report Template: Project Progress Tracking
advertisement

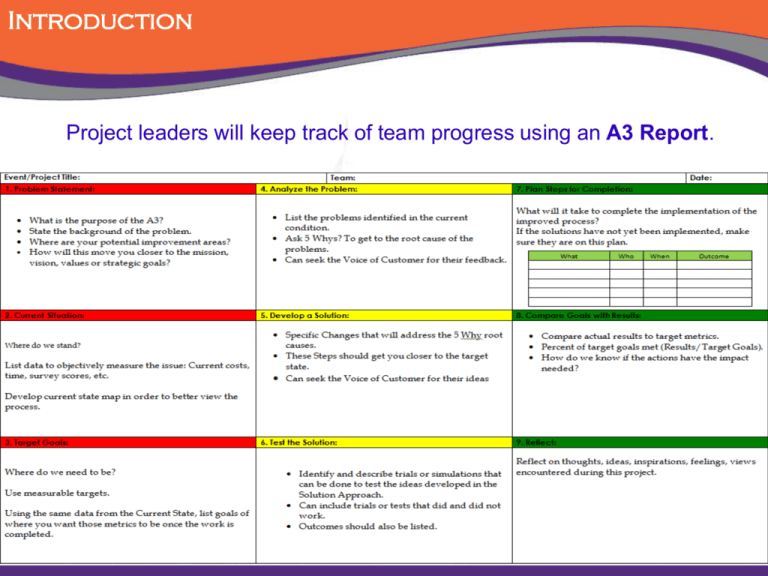
Introduction Project leaders will keep track of team progress using an A3 Report. Introduction Benefits of the A3 • It is an on-going visual guide of where you are and what happens next. • Think of it as both a map and a checklist. • This is your hands-on tool for the whole DMAIC process. D A3 Begin by thinking about your problem What areas can I target? What do I want to fix? What is the problem’s background? How does this relate to my mission, vision, etc.? 1. Problem Statement: D A3 Begin by thinking about your problem Where do we stand? How can I measure this? 2. Current Situation: How does this process run? Should I consider time, cost, survey scores or something else? D A3 Then by thinking about your ideal Where do we need to be? How far would I like to get? What are some measurable targets? When would I like to get there? 3. Target Goals: D Project Charter • Be sure to include briefly: • Who is being impacted? (This is your customer.) • What is the issue that is impacting the customer? • Where and when do the customers encounter the problem with the process? • What is the impact to the customer when the problem occurs? D Project Charter Be sure to consider, • What authority do we have? • What processes are we addressing? • What is not within scope? • What are the starting and ending points of the process? • What components of the business are/are not included? • What, if anything, is outside of the project boundaries? • What constraints must the team work under? D Project Charter BEWARE Scope Creep PROCESS • Not your job! Upstream Process • Stick with beginning /end points. • Not your job! Downstream Process Create boundaries and maintain them! D Project Charter What is a metric? • A measured variable that can be tracked and used to detect errors, inefficiency, or improvement. It can be a process metric or and organizational metric. Process metrics apply to specific processes or programs like time, cost, or quality. Organizational metrics address organization-wide issues like employee satisfaction and turnover. Choose one or more to describe accurately your process’ efficiency. D Project Charter Kinds of Metrics • Time Metrics – Value-added time – Non-valueadded time – Processing time – Cycle time • Cost Metrics – Cost savings – Opportunity cost – Decreased waste • Quality Metrics – Customer satisfaction – Percent complete and accurate • Output Metrics – Backlog – Work in process D Project Charter You must have a baseline to measure improvement. The Lean Office will help establish your baseline metrics. D A3 Now revise the A3 Problem Statement • Briefly explain what the project is and what your team hopes to achieve. • Also name your metrics. D A3 Problem Statement Example: M A3 Begin by thinking about your problem Where do we stand? What are some ways to measure this? 2. Current Situation: How does this process run? Should I consider time, cost, survey scores or something else? M A3 Then by thinking about your ideal Where do we need to be? What are some measurable targets? 3. Target Goals: How far would I like to get? When would I like to get there? M A3 Now revise the A3 Current Situation • Name your metric and record data from the current process. M A3 Current Situation Example A A3 Think about the data you have collected What problems can I identify? What are the root causes? Do my customers have relevant input? 4. Analyze the Problem: A A3 Now revise the A3 Analyze the Problem A A3 Analyze the Problem, Example 4. Analyze the Problem: Current Problems: Clemson pays invoices with no consideration for payment terms. Root Cause: There is no policy or procedure regarding discount identification or negotiation. We also recognized that we write too many checks and would like to move recipients towards electronic payments to eliminate waste. Waste Identified: discounts not taken; mailing vendor checks; invoices waiting on desks for approval. I A3 Think about the causes you have found What are some ways to resolve these issues? How can we move closer to our target? 5. Develop a Solution: I A3 Think about how you can verify your solutions How can we test our ideas? 6. Test the Solution: What outcomes should we achieve? I A3 Think about putting your solutions in place Who’s cooperation do we need? What resources do we need? When do we need this? 7. Plan Steps for Completion: I Solve Implementation Plan Who will be on the implementation team? What exactly will this step involve? When will the change take place? What is the expected outcome of this step? I A3 Now revise the A3 Develop a Solution I A3 Develop a Solution, Example 5. Develop a Solution: Specific changes addressing root cause: Charge a fee to receive a check; implement a policy stating we will pay vendors in 30 days. Steps to get closer to target: identify the top dollar vendors and work towards capturing discounts from the top 10 initially. I A3 Revise the A3 Test the Solution I A3 Test the Solution, Example 6. Test the Solution: We are assuming vendors want to be paid quickly. Once the system is set up to pay vendors in 30 days, we will take a sample to determine whether they will accept the discount. Clemson is still in the process of determining how best to charge a fee for writing checks. Some technical difficulties need to be resolved. I A3 Revise the A3 Plan Steps for Completion I A3 Plan Steps for Completion, Example 7. Plan Steps for Completion: . What Communicate the need to import invoices in a timely manner Who When Outcome Procurement ASAP Ability to pay vendor in specified time Establish system to pay vendor in 30 days Procurement ASAP Systems has been established to pay 30 days from receipt C A3 Think about your accomplishments What are the results? What did we hope to achieve? Can we be sure of our impact? 8. Compare Goals with Results: C A3 Think about what you and your team have learned Thoughts? Lessons learned? Ideas? 9. Reflect on the Project: C A3 Now revise the A3 Compare Goals with Results • Did your team meet the goals you set at the beginning? If not, explore the reasons why. C A3 Compare Goals with Results, Example 8. Compare Goals with Results: Goal: Move more individuals from check to e-check. • We have increased the percent of vendors receiving electronic payments from 6.2% to 30%. Goal: Capture discounts. • Many vendors prefer full payment to early payment. Still, 281 offer a discount for early payment. C A3 Revise the A3 Reflect on the Project • Consider the successes and failures. What experiences can be applied to future projects? • Is there room for more improvement? Return to Define! C A3 Reflect on the Project, Example 9. Reflect: There is always room for improvement. We overestimated the number of vendors we thought would want a discount. Because of the economy, many vendors decided they preferred full payment in 30 days rather than a 2% discount for early payment. We also experienced difficulty with the check writing fee. Implementation is the hardest phase and where the project can fail. To help avoid this, involve more stakeholders in the early phases.


