seminar in finance formulas final
advertisement

Seminar in Finance Formulas
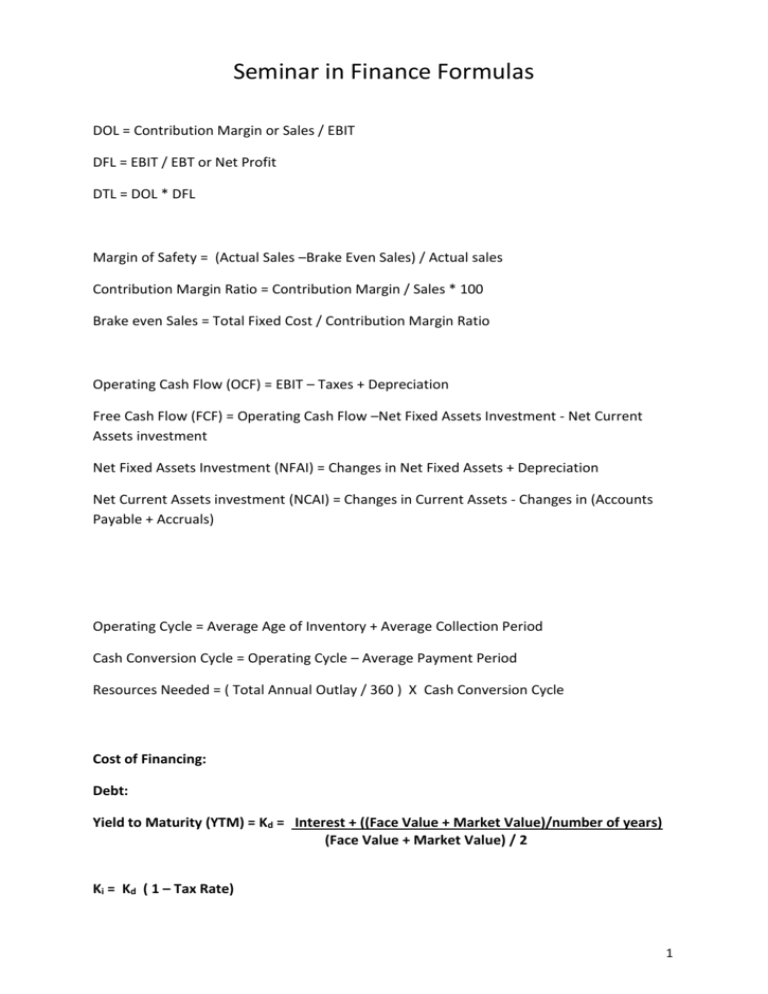
DOL = Contribution Margin or Sales / EBIT
DFL = EBIT / EBT or Net Profit
DTL = DOL * DFL
Margin of Safety = (Actual Sales –Brake Even Sales) / Actual sales
Contribution Margin Ratio = Contribution Margin / Sales * 100
Brake even Sales = Total Fixed Cost / Contribution Margin Ratio
Operating Cash Flow (OCF) = EBIT – Taxes + Depreciation
Free Cash Flow (FCF) = Operating Cash Flow –Net Fixed Assets Investment - Net Current
Assets investment
Net Fixed Assets Investment (NFAI) = Changes in Net Fixed Assets + Depreciation
Net Current Assets investment (NCAI) = Changes in Current Assets - Changes in (Accounts
Payable + Accruals)
Operating Cycle = Average Age of Inventory + Average Collection Period
Cash Conversion Cycle = Operating Cycle – Average Payment Period
Resources Needed = ( Total Annual Outlay / 360 ) X Cash Conversion Cycle
Cost of Financing:
Debt:
Yield to Maturity (YTM) = Kd = Interest + ((Face Value + Market Value)/number of years)
(Face Value + Market Value) / 2
Ki = Kd ( 1 – Tax Rate)
1
Preferred Stock:
K p = Dp / Np
Or
Kp = D1 / P0
Np = Net Proceeds From Sale of P/S
Common Stock Value:
Zero Growth:
Kp = D1 / P0
Constant Growth:
Ks = (D1 / P0 ) + G
G = Growth Rate
Variable Growth:
N
D
V0 ( Dt PVIF (k s , t per )) N 1 PVIF (k s , N per )
t 1
ks g 2
OR
PO =
[ { DO x (1 + g1)t } / (1 + KS) ] + [ { 1 / ( 1 + KS)N } X { ( DN + 1 ) / (KS-g2) } ]
Breaking Point (BPj) = AFj / Wj
AFj = Amount of Funds Available (from financing source j)
Wj = Capital Structure Weights (for financing source j)
Weighted Average Cost of Capital (WACC) = K = ( Wj *Kj ) + ( Wp *Kp ) + ( Ws *Ks )
2
Capital Asset Pricing Model (CAPM) = K = RF + β ( MR – RF )
RF = Risk Free Rate (Where beta is 0)
MR = Market Rate
β = Beta
K = Required Return = Real Rate + Inflation Premium + Risk Premium
RF = Real Rate + Inflation Premium
Risk Premium = K - RF
Present Value of Single Amount:
PVIF = Pv = Fv / ( 1 + K )n
Net Present Value = Sum of Total Present Values – Initial Investment
Present Value of Annuity:
PVIFA = Pmt [1- (1 / (1 + K)n ) ] / K
Annualized Net Present Value (ANPV) = NPV / PVIFA(k,n)
Initial Investment = cost of new machine + Installation Cost – after tax proceeds of old
machine + Change in Net Working Capital
Incremental Cash Flows = Earnings Before Tax – Tax + Depreciation – Old Machine Cash Flows
Terminal Cash Flow = after tax proceeds from sale of new machine - after tax proceeds from
sale of old machine + change in Net Working Capital
Internal Rate of Return (IRR):
Average of Total Cash Flows = sum of total cash flows / number of years
Factor = Initial Investment / Average of Total Cash Flows
3
Ratios
Liquidity Ratios
Current ratio
Quick ratio
Cash ratio
current assets/current liability
current assets-inventory/current liability
cash+ marketable securities/current liability
Activity Ratios
Inventory turnover
CGS/inventory
Avg. collection period
accounts receivable/avg. sales per day
Avg. payment period
accounts payable/avg. purchases per day
Account receivable turnover Annual credit sales/average account receivable
Account payable turnover
Annual credit purchase or CGS/Average account payable
Total assets turnover
sales/total assets
Fixed asset turnover
Annual sales/total fixed Assets
Debt Ratios
Debt ratio
Time interest earned ratio
Fixed Payment coverage ratio
total liabilities/total assets
EBIT/I
EBIT / (EBIT - Interest - Lease Payment - Before tax Preferred Dividend)
Profitability Ratios
Gross profit margin
gross profit/sales
Operating profit margin operating profits/sales
Net profit margin
EACS/sales
Earning per share
EACS/ shares outstanding
ROI
Net Profit / Average Total Assets or EBIT / Average Operating Assets
Return on total assets
EACS/ total assets
Return on common equity
EACS/common stock equity
Market ratios
Price/earning ratio
Market/book value ratio
Book value per share of c/s
Market / liquidation ratio
Mkt price per share/ EPS
Mkt price per share/book value per share
common stock equity/no. of share outstanding
Mkt price per share / liquidation value per share
Notes
CGS
Avg. stock
Capital
Fixed assets
Debtor’s
Account rec. turnover
Account payable turnover
Creditors
Closing stock
sales - gross profit
CGS/stock turnover
sales/capital turnover
sales/ fixed assets turnover
sales/ Account receivable turnover
12 or 365/debt collection period
12 or 365/credit payment period
CGS (including excess closing stock balance)/account payable turnover
op. stock + avg. stock+ excess balance of closing stock/ 2
4


