Infographic Webinar to POST - NC ELA Wiki
WELCOME TO OUR WEBINAR!
We will begin at 3:30.
Please check your equipment for sound.
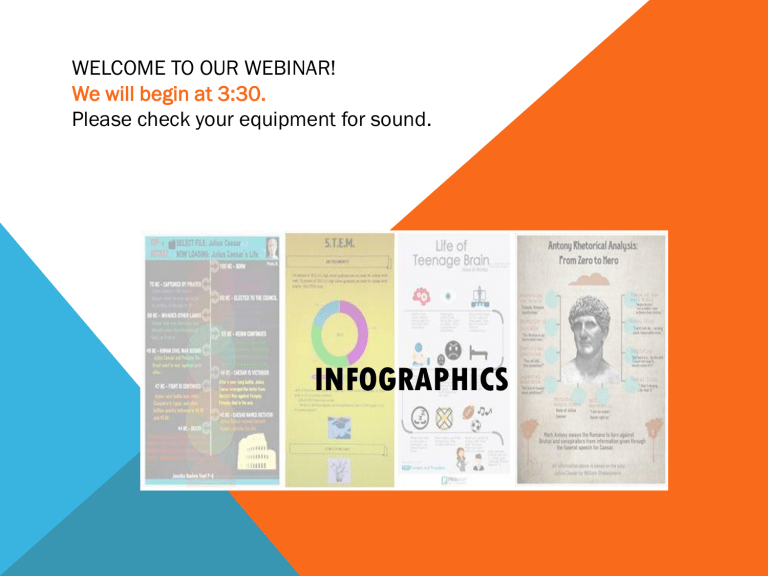
INFOGRAPHICS
WHAT IS AN INFOGRAPHIC?
EFFECTIVE INFOGRAPHICS
Visual Essay
Explicit Topic and Purpose (Thesis)
Supporting Evidence
An Illustrated Mode
Clean
• Avoid large chunks of text
• Avoid image overload
Accessible and Interesting
Topic and Purpose?
The infographic thesis
Supporting Evidence?
Credible
Organized, Coherent, and
Accessible
Mode?
Compare/Contrast
An effective essay must have a clear, explicit thesis. An effective infographic must have a clear, explicit topic/purpose. If not, the entire piece suffers.
Topic and
Purpose?
Supportin g
Evidence?
Mode?
POSTER VS. INFOGRAPHIC
WHAT’S THE DIFFERENCE?
GREAT EXAMPLES:
WHAT ARE THE BENEFITS OF USING OR
CREATING INFOGRAPHICS?
Excellent for visual learners.
Helps teach how to organize information effectively.
Great tool for emphasizing the importance of strong summaries.
Can be a way to teach how to synthesize information. (making charts and graphs)
Could be a way to practice the writing process.
Reading infographics helps to build knowledge about topics.
Reading infographics is a great way to practice interpreting facts from charts/graphs.
PRE-STEP: EXPLORE
• Look at several very strong examples of infographics that you have chosen in advance before beginning the steps.
• Use infographics to deliver information to your students.
• Talk about what makes this information accessible and interesting.
• Have great examples hanging in your room.
Resources: http://www.educatorstechnology.com/2012/12/60-great-educational-infographics-for.html
https://www.pinterest.com/officialascd/education-infographics/
STEP ONE: SELECT AN ENGAGING TOPIC
A successful infographic has a strong thesis statement worth arguing or an interesting topic worth exploring.
Resource: https://owl.english.purdue.edu/owl/owlprint/588/
STEP TWO: DECIDE PURPOSE AND MODE
Resource: http://piktochart.com/using-infographics-effectively-in-theclassroom-5-simple-ideas/
STEP THREE: GATHER THE DATA
This is the most important step to creating an effective infographic.
Credible
Solid
Resource: https://owl.english.purdue.edu/owl/resource/588/02/
STEP FOUR: ORGANIZE THE DATA
Resource: http://www.fastcodesign.com/1670019/10-steps-to-designing-an-amazing-infographic
STEP FIVE: PLAN AND PLAY
Resource: http://infographicsineducation.wikispaces.com/home
WHERE TO FIND INFOGRAPHIC TEMPLATES:
Visual.Ly
Easel.ly
Piktochart
Infogr.am
STEP SIX: CREATE AND EVALUATE
Checklist:
Clear Topic and Purpose
Illustrated Mode
Strong, Organized Supporting Evidence
Visual Interest
Resource: http://www.schrockguide.net/uploads/3/9/2/2/392267/schrock_infographic_rubric.pdf
STEP SEVEN: PUBLISH
7 STEPS FOR CREATING AN INFOGRAPHIC https://www.youtube.com/watch?v=MxTF10M38Ic&feature=youtu.be
IDEAS:
1. introduce the protagonist of a story
2. talk about a character’s decision in literature
3. highlight an important event or the climax in a story
4. compare a book with a movie
5. discuss the historical setting of a book
6. pre-teach a new subject
7. present a new idea or topic – build background knowledge
8. promote critical literacy
9. use as a draft to bigger research
10. creative assessment
WHERE CAN I GO TO LEARN MORE?
Here is a LiveBinder that has everything infographic: http://www.livebinders.com/play/play/143539
Larry Ferrlazzo keeps track of infographics with the “best of”: http://larryferlazzo.edublogs.org/2011/01/11/the-best-resources-for-creatinginfographics/
Kathy Schrock’s Guide to Infographics is full of great info and sites to explore: http://www.schrockguide.net/infographics-as-an-assessment.html
This lesson is one of our favorites: http://www.edutopia.org/blog/infographics-students-reading-history-sarah-gross
WHAT DO STUDENTS HAVE TO SAY
ABOUT INFOGRAPHICS?
The best thing about the infographic is when I finish it. It is a really good study guide for me. It helps me understand things about the concept better.
The most interesting part of making infographics was turning our boring vocabulary into something you can visually see and yet it helps you learn.
I think that the best part of making infographics is getting to understand the information and make it into a visual form that other people can look at to help them understand, and you can also look at theirs to help you understand.
The best part in making infographics was using pictures to help understand everything. Pictures really help.
Why do you like infographics?
“I SEE WHAT YOU MEAN”... INFOGRAPHICS!
EDUCATOR INFOGRAPHIC CONTEST
Show us what you can do!
Create a fabulous infographic on an educational topic of your choice and send it to julie.joslin@dpi.nc.gov by April 24.
We will choose the top three and the authors will win an instructional resource as well as be published in our May Scoop!
SUMMER OPPORTUNITY
IF YOU LOVE INFOGRAPHICS!
This summer we will offer a one day workshop on creating and using infographics to enrich instruction!
More information coming soon!
Join our listserve!
http://elaccss.ncdpi.wikispaces.net/listjoin
THANK YOU!
Thank you for attending!
Many thanks to the teachers from Bentonville Public Schools for the materials they shared at the NCTE conference last fall: http://center.uoregon.edu/NCTE/uploads/2014NCTEANNUAL/HANDOUTS/KEY_197
8614/NCTEInfographics.pdf
CONTACT INFORMATION
Julie Joslin, Ed.D.
Section Chief
English Language Arts
919-807-3935
Julie.Joslin@dpi.nc.gov
Anna Lea Frost, M.Ed.
6-8 English Language Arts
Consultant
919-807-3952
Anna.Frost@dpi.nc.gov
Angie Stephenson, M.Ed.
9-12 English Language Arts
Consultant
919-807-3833
Angela.Stephenson@dpi.nc.gov
Lisa McIntosh, MSA
K-5 English Language Arts
Consultant
919-807-3895
Lisa.Llewellyn@dpi.nc.gov
Resource: under “Webinars” http://elaccss.ncdpi.wikispaces.net/
