Statistical Measures Exit Slip: Comparing Populations
advertisement
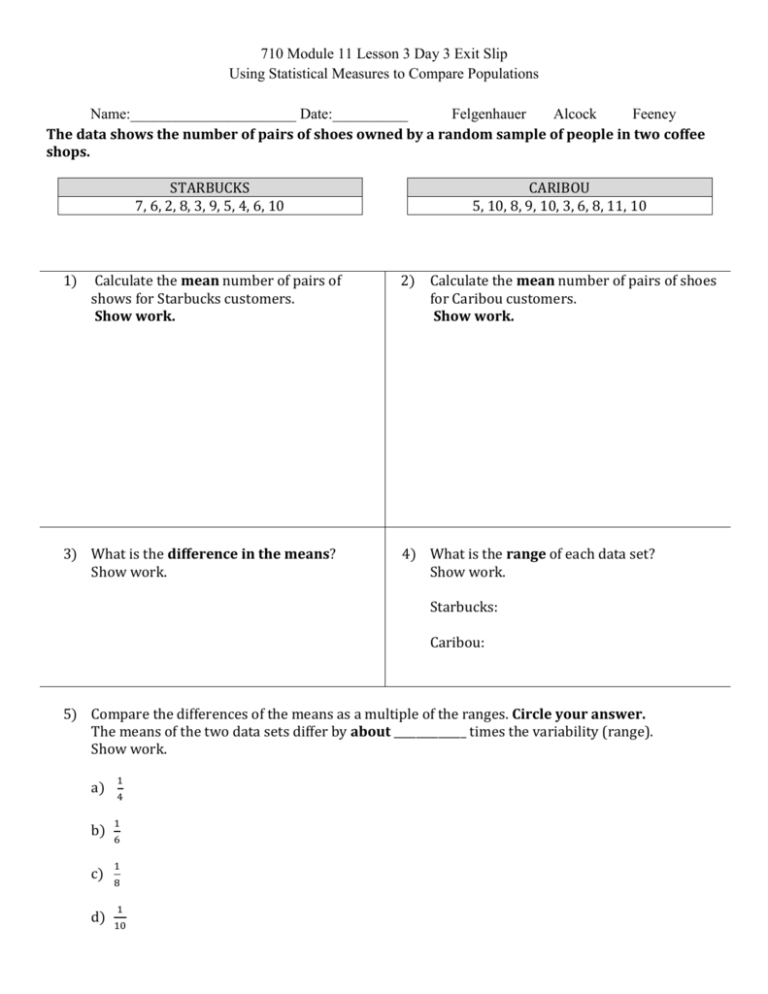
710 Module 11 Lesson 3 Day 3 Exit Slip Using Statistical Measures to Compare Populations Name:______________________ Date:__________ Felgenhauer Alcock Feeney The data shows the number of pairs of shoes owned by a random sample of people in two coffee shops. STARBUCKS 7, 6, 2, 8, 3, 9, 5, 4, 6, 10 1) Calculate the mean number of pairs of shows for Starbucks customers. Show work. 3) What is the difference in the means? Show work. CARIBOU 5, 10, 8, 9, 10, 3, 6, 8, 11, 10 2) Calculate the mean number of pairs of shoes for Caribou customers. Show work. 4) What is the range of each data set? Show work. Starbucks: Caribou: 5) Compare the differences of the means as a multiple of the ranges. Circle your answer. The means of the two data sets differ by about _____________ times the variability (range). Show work. a) b) c) d) 1 4 1 6 1 8 1 10 Statistical measures are shown below for the number of minutes per week students at Frost spent studying and watching TV per day. Studying : Mean number of minutes spent studying = 35 min (MAD) Mean absolute deviation = 5 Watching TV : Mean number of minutes spent watching TV = 45 min (MAD) Mean absolute deviation = 5 6) Find the difference between the means. Show work. 8) Complete the statement. Fill in the blank. 7) The difference of the means is ___________ times the MAD. 9) Answer Key: 1) 6 2) 8 3) 2 4) both have a range of 8 5) A 6) 10 7) 2 8) A 9) C

