Lab: Density of Zinc
advertisement
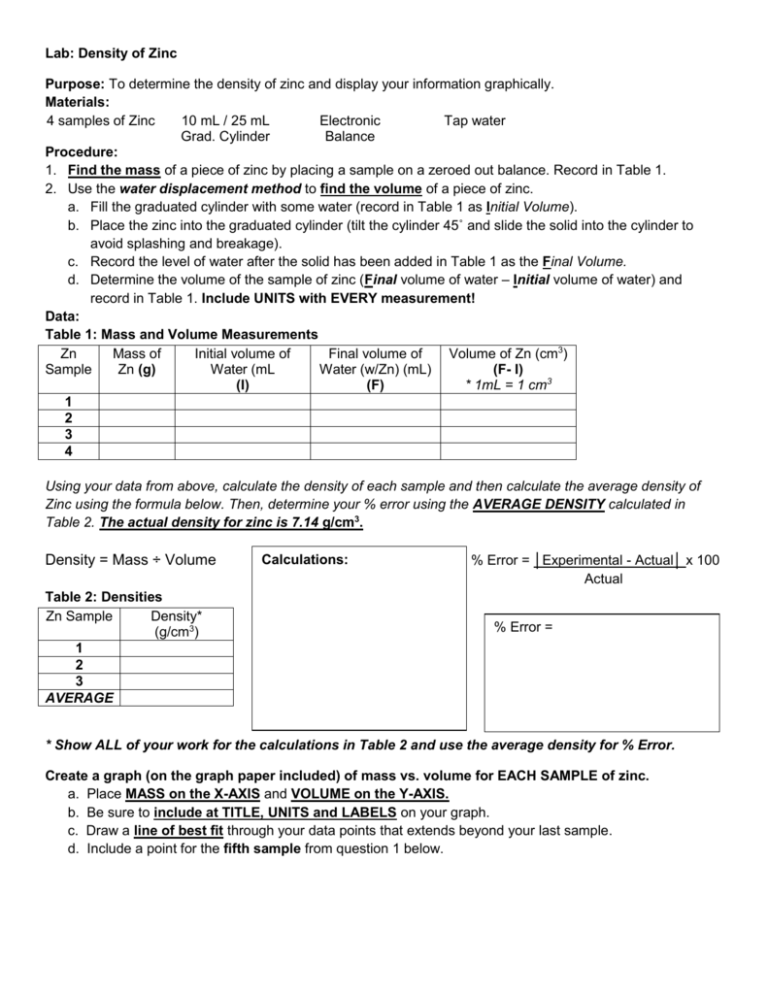
Lab: Density of Zinc Purpose: To determine the density of zinc and display your information graphically. Materials: 4 samples of Zinc 10 mL / 25 mL Electronic Tap water Grad. Cylinder Balance Procedure: 1. Find the mass of a piece of zinc by placing a sample on a zeroed out balance. Record in Table 1. 2. Use the water displacement method to find the volume of a piece of zinc. a. Fill the graduated cylinder with some water (record in Table 1 as Initial Volume). b. Place the zinc into the graduated cylinder (tilt the cylinder 45˚ and slide the solid into the cylinder to avoid splashing and breakage). c. Record the level of water after the solid has been added in Table 1 as the Final Volume. d. Determine the volume of the sample of zinc (Final volume of water – Initial volume of water) and record in Table 1. Include UNITS with EVERY measurement! Data: Table 1: Mass and Volume Measurements Zn Mass of Initial volume of Final volume of Volume of Zn (cm3) Zn (g) (F- I) Sample Water (mL Water (w/Zn) (mL) (I) (F) * 1mL = 1 cm3 1 2 3 4 Using your data from above, calculate the density of each sample and then calculate the average density of Zinc using the formula below. Then, determine your % error using the AVERAGE DENSITY calculated in Table 2. The actual density for zinc is 7.14 g/cm3. Density = Mass ÷ Volume Table 2: Densities Zn Sample Density* (g/cm3) 1 2 3 AVERAGE Calculations: % Error = │Experimental - Actual│ x 100 Actual % Error = * Show ALL of your work for the calculations in Table 2 and use the average density for % Error. Create a graph (on the graph paper included) of mass vs. volume for EACH SAMPLE of zinc. a. Place MASS on the X-AXIS and VOLUME on the Y-AXIS. b. Be sure to include at TITLE, UNITS and LABELS on your graph. c. Draw a line of best fit through your data points that extends beyond your last sample. d. Include a point for the fifth sample from question 1 below. Analysis Questions: 1. Plot a 5th point on your graph corresponding to a piece of zinc that would have a mass of 15.00 g. According to the graph, what would the volume be? 2. Now calculate the volume of water that would be displaced by a sample of zinc with a mass of 15.00 g. How does this number compare with that extrapolated from the graph?


