Water Level Study 2
advertisement
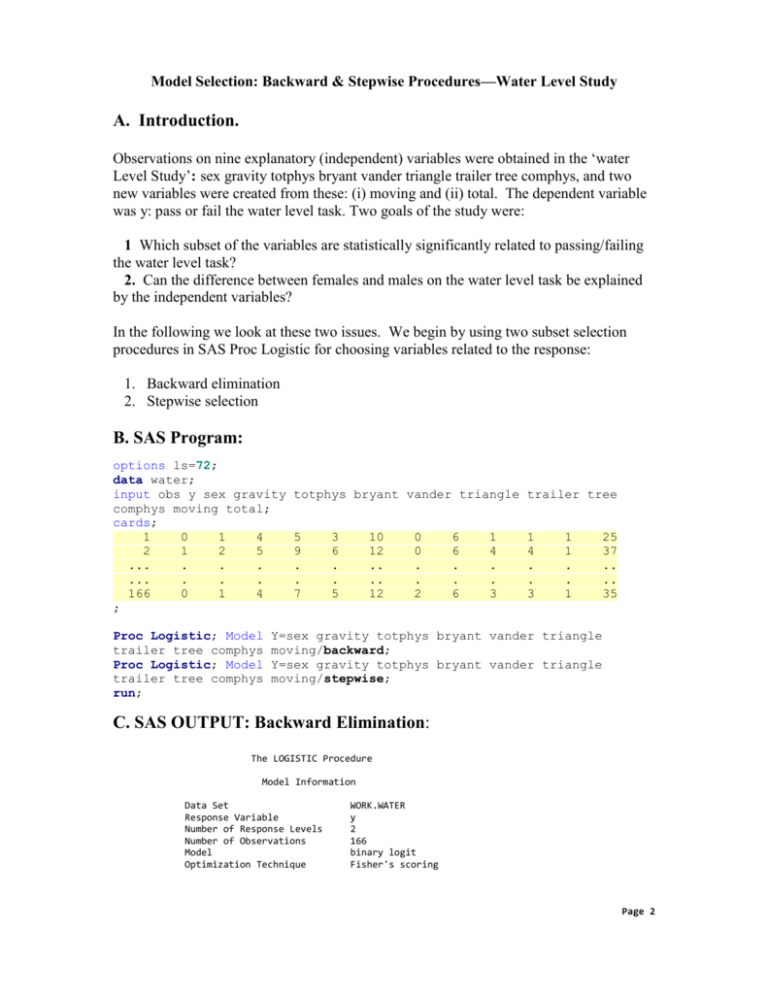
Model Selection: Backward & Stepwise Procedures—Water Level Study A. Introduction. Observations on nine explanatory (independent) variables were obtained in the ‘water Level Study’: sex gravity totphys bryant vander triangle trailer tree comphys, and two new variables were created from these: (i) moving and (ii) total. The dependent variable was y: pass or fail the water level task. Two goals of the study were: 1 Which subset of the variables are statistically significantly related to passing/failing the water level task? 2. Can the difference between females and males on the water level task be explained by the independent variables? In the following we look at these two issues. We begin by using two subset selection procedures in SAS Proc Logistic for choosing variables related to the response: 1. Backward elimination 2. Stepwise selection B. SAS Program: options ls=72; data water; input obs y sex gravity comphys moving total; cards; 1 0 1 4 2 1 2 5 ... . . . ... . . . 166 0 1 4 ; Proc Logistic; Model trailer tree comphys Proc Logistic; Model trailer tree comphys run; totphys bryant vander triangle trailer tree 5 9 . . 7 3 6 . . 5 10 12 .. .. 12 0 0 . . 2 6 6 . . 6 1 4 . . 3 1 4 . . 3 1 1 . . 1 25 37 .. .. 35 Y=sex gravity totphys bryant vander triangle moving/backward; Y=sex gravity totphys bryant vander triangle moving/stepwise; C. SAS OUTPUT: Backward Elimination: The LOGISTIC Procedure Model Information Data Set Response Variable Number of Response Levels Number of Observations Model Optimization Technique WORK.WATER y 2 166 binary logit Fisher's scoring Page 2 Response Profile Ordered Value y Total Frequency 1 2 0 1 96 70 Probability modeled is y=0. Stepwise Selection Procedure Step 0. The following effects were entered: Intercept sex gravity tree comphys moving totphys bryant vander triangle trailer Model Convergence Status Convergence criterion (GCONV=1E-8) satisfied. Model Fit Statistics Criterion AIC SC -2 Log L Intercept Only Intercept and Covariates 228.036 231.148 226.036 145.104 179.336 123.104 Testing Global Null Hypothesis: BETA=0 Test Chi-Square DF Pr > ChiSq 102.9319 75.9882 39.8693 10 10 10 <.0001 <.0001 <.0001 Likelihood Ratio Score Wald Step 1. Effect triangle is removed: Model Fit Statistics Criterion AIC SC -2 Log L Intercept Only Intercept and Covariates 228.036 231.148 226.036 143.139 174.259 123.139 Page 3 Testing Global Null Hypothesis: BETA=0 Test Chi-Square DF Pr > ChiSq 102.8970 75.3948 39.8243 9 9 9 <.0001 <.0001 <.0001 Likelihood Ratio Score Wald Residual Chi-Square Test Chi-Square DF Pr > ChiSq 0.0345 Step 1 0.8527 2. Effect totphys is removed: Model Fit Statistics Criterion AIC SC -2 Log L Intercept Only Intercept and Covariates 228.036 231.148 226.036 142.376 170.384 124.376 Testing Global Null Hypothesis: BETA=0 Test Chi-Square DF Pr > ChiSq 101.6598 74.7438 39.6571 8 8 8 <.0001 <.0001 <.0001 Likelihood Ratio Score Wald Residual Chi-Square Test Step Chi-Square DF Pr > ChiSq 0.9347 2 0.6267 3. Effect comphys is removed: Model Fit Statistics Criterion AIC SC -2 Log L Intercept Only Intercept and Covariates 228.036 231.148 226.036 141.542 166.438 125.542 Page 4 Testing Global Null Hypothesis: BETA=0 Test Chi-Square DF Pr > ChiSq 100.4940 73.5038 37.9008 7 7 7 <.0001 <.0001 <.0001 Likelihood Ratio Score Wald Residual Chi-Square Test Step Chi-Square DF Pr > ChiSq 2.0543 3 0.5612 4. Effect sex is removed: Model Fit Statistics Criterion Intercept Only Intercept and Covariates AIC SC -2 Log L 228.036 231.148 226.036 142.385 164.169 128.385 Testing Global Null Hypothesis: BETA=0 Test Chi-Square DF Pr > ChiSq 97.6504 70.8081 37.6798 6 6 6 <.0001 <.0001 <.0001 Likelihood Ratio Score Wald Residual Chi-Square Test Chi-Square DF Pr > ChiSq 4.8313 4 0.3050 NOTE: No (additional) effects met the 0.05 significance level for entry into the model. Summary of Stepwise Selection Step Removed 1 2 3 4 triangle totphys comphys sex Effect DF Number In 1 1 1 1 Wald Chi-Square 9 8 7 6 .0345 0.8349 1.1476 2.8044 Pr > ChiSq 0.8527 0.3609 0.2840 0.0940 Page 5 Analysis of Maximum Likelihood Estimates Parameter DF Estimate Standard Error Wald Chi-Square Pr > ChiSq Intercept gravity bryant vander trailer tree moving 1 1 1 1 1 1 1 7.8773 -0.5583 -0.3691 -0.2044 -0.7125 -0.4932 2.4148 2.2166 0.1783 0.1737 0.0712 0.2961 0.1642 0.9041 12.6295 9.8099 4.5149 8.2388 5.7890 9.0239 7.1340 0.0004 0.0017 0.0336 0.0041 0.0161 0.0027 0.0076 Odds Ratio Estimates Effect Point Estimate gravity bryant vander trailer tree moving 0.572 0.691 0.815 0.490 0.611 11.187 95% Wald Confidence Limits 0.403 0.492 0.709 0.274 0.443 1.902 0.811 0.972 0.937 0.876 0.842 65.808 C2. SAS OUTPUT: Stepwise Selection Procedure Step 0. Intercept entered: Model Convergence Status Convergence criterion (GCONV=1E-8) satisfied. Residual Chi-Square Test Step Chi-Square DF Pr > ChiSq 75.9882 10 <.0001 1. Effect totphys entered: Model Fit Statistics Criterion AIC SC -2 Log L Intercept Only Intercept and Covariates 228.036 231.148 226.036 182.993 189.217 178.993 Page 6 Testing Global Null Hypothesis: BETA=0 Test Chi-Square DF Pr > ChiSq 47.0426 41.5656 32.9603 1 1 1 <.0001 <.0001 <.0001 Likelihood Ratio Score Wald Residual Chi-Square Test Step Chi-Square DF Pr > ChiSq 44.3755 9 <.0001 2. Effect vander entered: Model Fit Statistics Criterion AIC SC -2 Log L Intercept Only Intercept and Covariates 228.036 231.148 226.036 165.484 174.820 159.484 Testing Global Null Hypothesis: BETA=0 Test Chi-Square DF Pr > ChiSq 66.5513 57.2050 41.6365 2 2 2 <.0001 <.0001 <.0001 Likelihood Ratio Score Wald Residual Chi-Square Test Step Chi-Square DF Pr > ChiSq 28.3054 8 0.0004 3. Effect tree entered: Model Fit Statistics Criterion Intercept Only Intercept and Covariates 228.036 231.148 226.036 156.637 169.085 148.637 AIC SC -2 Log L Page 7 Testing Global Null Hypothesis: BETA=0 Test Chi-Square DF Pr > ChiSq 77.3983 64.0331 42.4435 3 3 3 <.0001 <.0001 <.0001 Likelihood Ratio Score Wald Residual Chi-Square Test Step Chi-Square DF Pr > ChiSq 20.8917 7 0.0039 4. Effect trailer entered: Model Fit Statistics Criterion AIC SC -2 Log L Intercept Only Intercept and Covariates 228.036 231.148 226.036 150.284 165.844 140.284 Testing Global Null Hypothesis: BETA=0 Test Chi-Square DF Pr > ChiSq 85.7518 66.7439 40.2427 4 4 4 <.0001 <.0001 <.0001 Likelihood Ratio Score Wald Residual Chi-Square Test Step Chi-Square DF Pr > ChiSq 15.3522 6 0.0177 5. Effect moving entered: Model Fit Statistics Criterion AIC SC -2 Log L Intercept Only Intercept and Covariates 228.036 231.148 226.036 143.792 162.463 131.792 Page 8 Testing Global Null Hypothesis: BETA=0 Test Chi-Square DF Pr > ChiSq 94.2442 69.0294 39.2090 5 5 5 <.0001 <.0001 <.0001 Likelihood Ratio Score Wald Residual Chi-Square Test Step Chi-Square DF Pr > ChiSq 8.0348 5 0.1543 6. Effect bryant entered: Model Fit Statistics Criterion Intercept Only Intercept and Covariates 228.036 231.148 226.036 141.725 163.509 127.725 AIC SC -2 Log L Testing Global Null Hypothesis: BETA=0 Test Chi-Square DF Pr > ChiSq 98.3107 71.9151 40.1958 6 6 6 <.0001 <.0001 <.0001 Likelihood Ratio Score Wald Residual Chi-Square Test Chi-Square DF Pr > ChiSq 4.0274 4 0.4023 NOTE: No (additional) effects met the 0.05 significance level for entry into the model. Step 1 2 3 4 5 6 Summary of Stepwise Selection Effect Number Score Entered Removed DF In Chi-Square totphys vander tree trailer moving bryant 1 1 1 1 1 1 1 2 3 4 5 6 41.5656 19.1098 10.6764 6.6594 7.5976 3.9691 Pr > ChiSq <.0001 . <.0001. 0.0011 . 0.0099 . 0.0058 . 0.0463 . Page 9 Analysis of Maximum Likelihood Estimates Parameter DF Estimate Standard Error Wald Chi-Square Pr > ChiSq Intercept totphys bryant vander trailer tree moving 1 1 1 1 1 1 1 7.7840 -0.3914 -0.3412 -0.2059 -0.6802 -0.4534 2.3768 2.1401 0.1209 0.1739 0.0719 0.2846 0.1640 0.8904 13.2297 10.4818 3.8479 8.2126 5.7122 7.6388 7.1250 0.0003 0.0012 0.0498 0.0042 0.0168 0.0057 0.0076 Odds Ratio Estimates Effect Point Estimate totphys bryant vander trailer tree moving 0.676 0.711 0.814 0.507 0.635 10.771 95% Wald Confidence Limits 0.533 0.506 0.707 0.290 0.461 1.881 0.857 1.000 0.937 0.885 0.876 61.684 D. Conclusions. 1. Variables Selected and Estimates Odds Ratio Estimates Backward elimination Effect gravity bryant vander trailer tree moving Point Estimate 0.572 0.691 0.815 0.490 0.611 11.187 95% Wald Confidence Limits 0.403 0.492 0.709 0.274 0.443 1.902 0.811 0.972 0.937 0.876 0.842 65.808 Stepwise Selection Effect Point Estimate totphys bryant vander trailer tree moving 0.676 0.711 0.814 0.507 0.635 10.771 95% Wald Confidence Limits 0.533 0.506 0.707 0.290 0.461 1.881 0.857 1.000 0.937 0.885 0.876 61.684 The two procedures each selected 6 variables with 5 in common; backward elimination chose ‘gravity’ while stepwise chose ‘totphysics’. The odd ratio and confidence interval estimates are quite close for all variables. 2. Neither model includes ‘sex’. We conclude that adjusted for these 6 independent variables ‘sex’ does not affect passing/failing.
