CPM Calculations
advertisement
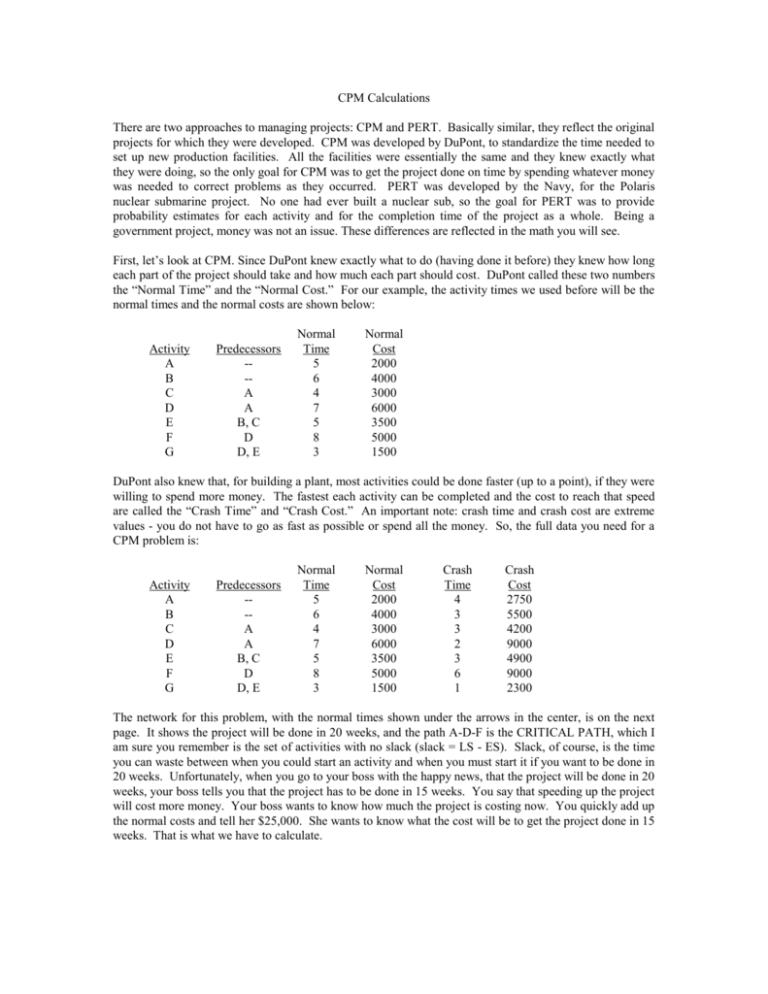
CPM Calculations There are two approaches to managing projects: CPM and PERT. Basically similar, they reflect the original projects for which they were developed. CPM was developed by DuPont, to standardize the time needed to set up new production facilities. All the facilities were essentially the same and they knew exactly what they were doing, so the only goal for CPM was to get the project done on time by spending whatever money was needed to correct problems as they occurred. PERT was developed by the Navy, for the Polaris nuclear submarine project. No one had ever built a nuclear sub, so the goal for PERT was to provide probability estimates for each activity and for the completion time of the project as a whole. Being a government project, money was not an issue. These differences are reflected in the math you will see. First, let’s look at CPM. Since DuPont knew exactly what to do (having done it before) they knew how long each part of the project should take and how much each part should cost. DuPont called these two numbers the “Normal Time” and the “Normal Cost.” For our example, the activity times we used before will be the normal times and the normal costs are shown below: Activity A B C D E F G Predecessors --A A B, C D D, E Normal Time 5 6 4 7 5 8 3 Normal Cost 2000 4000 3000 6000 3500 5000 1500 DuPont also knew that, for building a plant, most activities could be done faster (up to a point), if they were willing to spend more money. The fastest each activity can be completed and the cost to reach that speed are called the “Crash Time” and “Crash Cost.” An important note: crash time and crash cost are extreme values - you do not have to go as fast as possible or spend all the money. So, the full data you need for a CPM problem is: Activity A B C D E F G Predecessors --A A B, C D D, E Normal Time 5 6 4 7 5 8 3 Normal Cost 2000 4000 3000 6000 3500 5000 1500 Crash Time 4 3 3 2 3 6 1 Crash Cost 2750 5500 4200 9000 4900 9000 2300 The network for this problem, with the normal times shown under the arrows in the center, is on the next page. It shows the project will be done in 20 weeks, and the path A-D-F is the CRITICAL PATH, which I am sure you remember is the set of activities with no slack (slack = LS - ES). Slack, of course, is the time you can waste between when you could start an activity and when you must start it if you want to be done in 20 weeks. Unfortunately, when you go to your boss with the happy news, that the project will be done in 20 weeks, your boss tells you that the project has to be done in 15 weeks. You say that speeding up the project will cost more money. Your boss wants to know how much the project is costing now. You quickly add up the normal costs and tell her $25,000. She wants to know what the cost will be to get the project done in 15 weeks. That is what we have to calculate. 2 5 5 A 0 1 6 5 5 D 7 12 12 8 5 4 1712 12 12 5 F 8 0 0 4 C B 6 12 9 6 12 3 9 12 E 14 17 5 5 14 17 6 17 20 G 1712 20 20 3 The first step is to remember that the critical path is the longest path through the network. Try it and see. The other paths you can trace through the network, and the total of their activity times, is shown next: Path A-D-F A-C-E-G A-D-Dummy-G B-E-G Time 20 17 15 14 Now, if we want to spend money to speed the project, we want to spend the money where it will do the most good, and we want to spend as little money as possible. Consider activity G. If we were to spend money to speed up activity G by one week, then the last three paths would all be done one week faster. Unfortunately, the longest path through the network, A-D-F, wasn’t affected, and still takes 20 weeks to complete. This means we wasted the money, because the project will still take 20 weeks to complete. So, if we want to avoid wasting our money, we should only look at the critical path as a place to spend money. The process of spending money to speed up an activity is called “crashing” the network. So, we find the critical path and crash one or more activities on it until we get to our 15 week completion time. Except, it’s not quite that simple. You still want to spend as little money as possible, and you have to be careful because the critical path can shift as you crash the network. To watch out for this, you do not automatically jump some activity from its normal activity time to its crash activity time. Instead, you perform a little calculation which will tell you two things: which of the critical activities is the least expensive for crashing, and what the cost will be to crash each activity 1 week. This calculation is called the “Crash Cost Per Period” and is calculated by finding the increase in cost (Crash Cost - Normal Cost) and dividing by the decrease in time (Normal Time Crash Time), as is shown next: Activity A B C D E F G Predecessors --A A B, C D D, E Normal Time 5 6 4 7 5 8 3 Normal Cost 2000 4000 3000 6000 3500 5000 1500 Crash Time 4 3 3 2 3 6 1 Crash Cost 2750 5500 4200 9000 4900 9000 2300 Crash Cost Calculation Per Period (2750-2000)/(5-4) = 750/1 = 750* (5500-4000)/(6-3) = 1500/3 = 500 (4200-3000)/(4-3) = 1200/1 = 1200 (9000-6000)/(7-2) = 3000/5 = 600* (4900-3500)/(5-3) = 1400/2 = 700 (9000-5000)/(8-6) = 4000/2 = 2000* (2300-1500)/(3-1) = 800/2 = 400 The asterisk (*) next to the critical activities make them easier to find. Now, crashing one critical activity is just as good as crashing another critical activity, so we should look at the critical path, A-D-F, and find the activity that will cost us the least on a per-week basis. This is activity D, with a CC/P of $600. Notice that activities B and G cost less per period, but those activities are no good to us because they are not critical activities. Since activity D is the critical path activity that costs the least, we will reduce its activity time by one week, from 7 to 6, spending $600 to do so, and look at how the network changes for this simple change in the data: 2 5 5 A 0 1 5 5 5 D 6 11 11 7 5 4 1611 11 11 5 F 8 0 0 4 C B 6 11 9 6 11 3 9 11 E 5 14 16 5 6 17 19 G 1611 19 19 3 14 16 The first change is that D is now done in 11 weeks instead of 12 (compare the earlier network to this new one) which means F can start earlier and therefore finish earlier, in 19 weeks. This changes the LF and LS calculations for most of the network (see why we do this on computer?), resulting in the numbers shown above. The important points are that the project can be done 1 week earlier AND the non-critical activities now have one week’s less slack. This last point is very important. If you keep on losing slack every time you crash an activity, eventually every activity will have zero slack, and will be critical. That can be a problem. For now, though, the critical path is still A-D-F and you can continue crashing the network. You would like to crash D again, because it is still the cheapest way to speed up the critical path. First, though, you have to check to see if you CAN crash D again. The fastest you can get D done is 2 weeks, shown as the crash time in your data. You reduced D from 7 weeks to 6 weeks, so you can continue to go further. If you ever get D down to 2 weeks, you will have to look at some other activity for further crashing. Right now, though, we will spend another $600 to crash D again, from 6 weeks to 5 weeks. Now the network, with the appropriate changes, looks like: 2 5 5 A 0 1 4 5 5 D 5 10 10 6 5 4 1610 10 10 5 F 8 0 0 4 C B 6 10 9 6 10 3 9 10 E 5 14 15 5 14 15 6 17 18 G 1610 18 18 3 Once again, D is done faster, so F can start sooner and the whole project is completed 1 week earlier (the completion time is now 18 weeks). This changes most of the calculations again, and again reduces the slack for the non-critical activities. The critical path, though, is still the same, and since D can be reduced all the way down to an activity time of 2, we can repeat this whole procedure and crash D at least one more time, from 5 to 4, spending $600 again to get: 5 A 0 1 3 5 5 2 5 D 4 9 9 5 5 4 14 9 9 9 F 5 8 0 0 4 C B 9 6 9 6 9 9 9 3 E 5 14 14 5 6 17 17 G 14 9 17 17 3 14 14 Now we have something interesting. Our completion time is down to 17 weeks, almost to our goal of 15 weeks, but crashing will now get more difficult. Having crashed D three times, reducing D’s activity time from 7 weeks to 4 weeks and spending $1,800, activities C, E, and G now have no more slack (their ES and LS are the same). What this means is that there are two critical paths through the network. Since a critical path runs all the way from the first node to the last, one critical path is still A-D-F, and the new critical path is A-C-E-G. One activity, such as A, can be on more than one critical path. This is a problem because now we have to speed up both critical paths if we want to speed up the whole project, and speeding up two critical paths will cost us more money. On the original critical path, D is still the least expensive activity to crash, and we can crash D two more weeks. On the new critical path (A-C-E-G), activity G is the cheapest activity to crash, at a cost of $400 per week. Crashing both of them, though, will cost us $1000 per week, which is pretty expensive. However, there is a better way. Activity A lies on both paths. If we crash activity A, we will speed up both paths at the same time, and A only costs us $750 per week. To see this, reduce A from 5 weeks to 4 weeks on the network and recalculate all the ES, EF, LF, and LS. You get: 4 A 0 1 2 4 4 2 4 D 4 8 8 4 4 4 13 8 8 8 4 F 8 0 0 4 C B 8 6 8 6 8 3 8 8 E 5 13 13 5 13 13 6 16 16 G 13 8 16 16 3 You have now spent a total of $2550 ($1800 on D and $750 on A) to reduce the completion time to 16 weeks, and you are almost at your goal. You still have two critical paths, for that matter there is only one activity that is not critical, activity B (unless you count the Dummy, which is OK), and B is down to 2 weeks of slack. You only need to speed up the project by one more week. You would like to use activity A again, but you can’t. The fastest A can be done is 4 weeks, and you are already at that limit. You should check for any other common activities between the critical paths, but there are none (A-D-F and A-C-E-G only have one activity in common), so you have to go back to looking at individual activities on the separate paths, which means more expense. Activity D is still the least expensive activity to crash on critical path AD-F, and can be crashed another week, so that is half of the solution. For the other critical path, A-C-E-G, activity G, at $400, is the least expensive, so you will have to crash both of them at the same time to reduce the project to a 15 week completion time. This gives you: 4 A 0 1 2 4 4 2 4 D 3 7 7 4 4 4 13 7 7 7 F 4 8 0 0 4 C B 8 6 8 6 8 3 8 8 E 5 13 13 5 13 13 6 15 15 G 13 7 15 15 2 If you like, go through the network only crashing D or only crashing G, and you will see that the project completion time does not decrease; all you do is create slack on the critical path you crashed. Having crashed both, the project is done in 15 weeks and you can go back to your boss and tell her that the additional cost will be $3,550. for a total project cost of $28,550 (the sum of the normal costs was $25,000 and the total crash costs were $3,550). It useful to present this same information in another way. Set up a table showing your boss what you did at each step and what you gained. Such a table might look like: Critical Path A-D-F A-D-F A-D-F A-D-F A-D-F & A-C-E-G A-D-F & A-C-E-G A-D-F & A-C-E-G A-D-F & A-C-E-G A-D-F & A-C-E-G Activity Crashed D D D A D and G D and G E and F E and F Completion Time 20 weeks 19 weeks 18 weeks 17 weeks 16 weeks 15 weeks 14 weeks 13 weeks 12 weeks Additional Cost $600 $600 $600 $750 $1,000 $1,000 $2700 $2700 Total Cost $25,000 $25,600 $26,200 $26,800 $27,550 $28,550 $29,550 $32,250 $34,950 The advantage of a table like this one is that your boss can see for herself the tradeoff between dollars and time. If you go to your boss and simply say that it will cost $28,550 to get done in 15 weeks, all your boss can do is take your recommendation or reject it. If you present this table, your boss might decide that the final $1,000 is simply too much, and a 16 week deadline is acceptable. Possible, the project budget is limited to $27,000, so with this table your boss knows the project can be done in 17 weeks and can stay within budget. Since we have chosen the least expensive crash at each step, your boss can make her decisions with confidence.
