MS Excel 2007 – Basic Chart Elements
advertisement

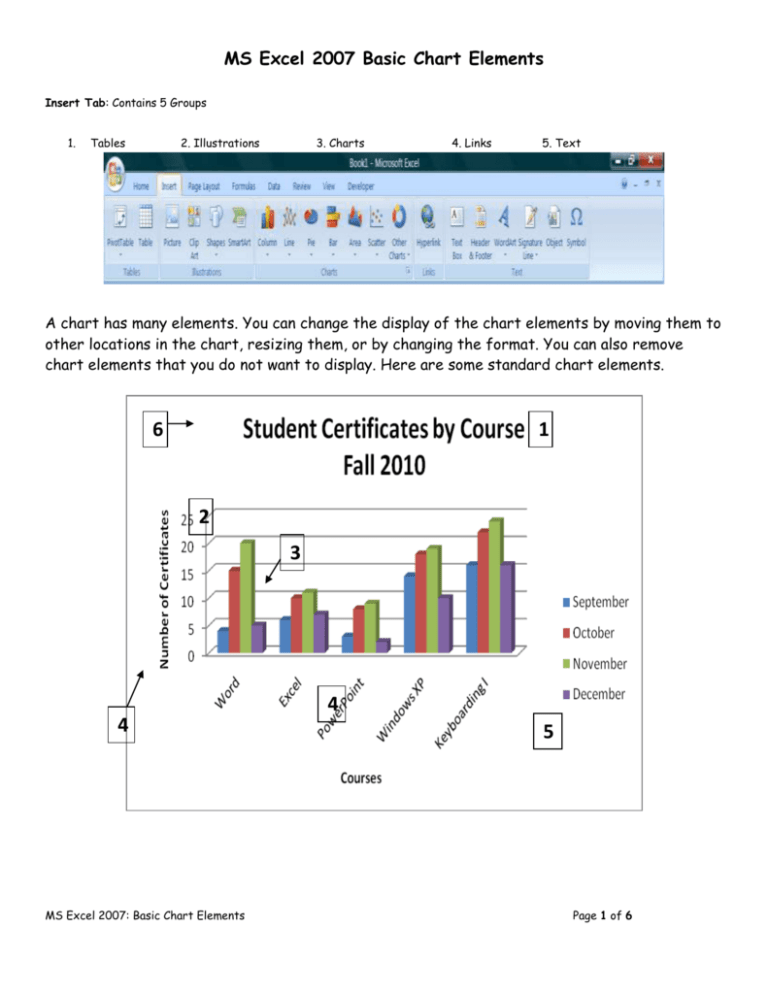
MS Excel 2007 Basic Chart Elements Insert Tab: Contains 5 Groups 1. Tables 2. Illustrations 3. Charts 4. Links 5. Text A chart has many elements. You can change the display of the chart elements by moving them to other locations in the chart, resizing them, or by changing the format. You can also remove chart elements that you do not want to display. Here are some standard chart elements. 6 1 2 3 4 MS Excel 2007: Basic Chart Elements 4 5 Page 1 of 6 Chart Elements 1. The chart area encompasses the entire chart and all its elements. 2. The plot area is that area bounded by the axes, including all data series, category names, axis titles, and all markers that represent data points. 3. The data points are the individual values plotted in a chart and represented by bars, columns, lines, pie or doughnut slices, dots, and various other shapes called data markers. Data markers of the same color constitute a data series (i.e. related data points. You can plot one or more data series in a chart, but pie charts have only one data series. 4. The horizontal (category) or vertical (value) axis is a line bordering the chart plot area used as a frame of reference for measurement. There are 2 axis: The y-axis is usually the vertical axis and contains data. The x-axis is usually the horizontal axis and contains categories. 5. A legend is a box that identifies the patterns or colors that are assigned to the data series or categories in a chart. 6. A chart title is the descriptive text for a chart. Note that horizontal and vertical axes usually have titles too. Changing and Reformatting Charts After you create a chart, you can change it. For example, you may want to change the way that axes are displayed, add a chart title, move or hide the legend, or display additional chart elements. There are two ways to modify an element in the chart: a. Right-click on it and choose the appropriate (format) option. b. Use the appropriate tabs, groups and options under Chart Tools. Basic Steps to Create Charts in Excel 2007 Charts start with data. In Excel 2007, you just select data in your worksheet, choose a chart type that best suits your purpose, and click. That’s all! MS Excel 2007: Basic Chart Elements Page 2 of 6 You can also use the new Chart Tools to customize the design, layout, and formatting of your chart. 4 Clicks to create a simple chart in Excel 2007 Can you believe you only need to do 4 clicks and you will get a simple chart? Let’s try this! Let’s say we want to see the number of certificates issued in the computer lab from September through December. Here are the 4 clicks: 1. Select the cells containing the certificate date/information, including cells with text (e.g. column and row headings for the data.) In this example, the cells are A3:E8. 2. Select Insert tab. 3. Select Column icon from Charts group. 4. Select 3-D Clustered Column chart MS Excel 2007: Basic Chart Elements Page 3 of 6 The above chart shows the NUMBER of CERTIFICATES issued by MONTH and the TYPE of CERTIFICATES. What if we want to see what happened in the NUMBER of CERTIFICATES month over month? Right click, Select Data, click SWITCH ROW/COLUMN, click OK. MS Excel 2007: Basic Chart Elements Page 4 of 6 MS Excel 2007: Basic Chart Elements Page 5 of 6 Formatting Chart Elements Titles: Add titles to a chart: Chart Tools -> Layout -> Labels -> Chart Title Add axis titles to a chart: Chart Tools -> Layout -> Labels -> Axis Title Legend: Add legend to a chart: Chart Tools -> Layout -> Labels -> Legend Data Labels: Add data labels to a chart: Chart Tools -> Layout -> Labels -> Data Labels Add data table to a chart: Chart Tools -> Layout -> Labels -> Data Table Formatting To change formatting and layout of each axes: Chart Tools -> Layout -> Axes -> Axes To turn gridlines on or off: Chart Tools -> Layout -> Axes -> Gridlines To format the plot area: Chart Tools -> Background -> Plot Area To format the chart wall (for 3-D charts): Chart Tools -> Background -> Chart Wall To format the chart floor (for 3-D charts): Chart Tools -> Background -> Chart Floor To change 3D viewpoint of a chart: Chart Tools -> Background -> 3-D Rotation Moving/Copying Charts To move chart to a different sheet: Chart Tools -> Design -> Location -> Move Chart MS Excel 2007: Basic Chart Elements Page 6 of 6


