Preliminary Results announcement in Word
advertisement
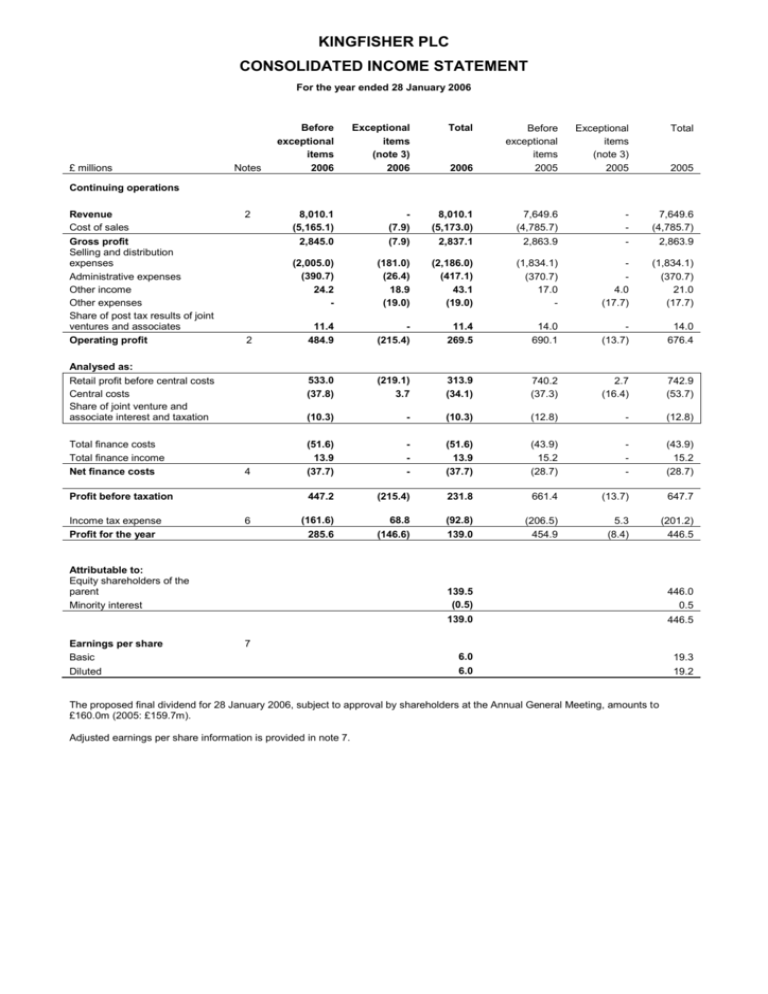
KINGFISHER PLC CONSOLIDATED INCOME STATEMENT For the year ended 28 January 2006 £ millions Notes Before exceptional items 2006 Exceptional items (note 3) 2006 Total 8,010.1 (5,165.1) 2,845.0 Exceptional items (note 3) 2005 Total 2006 Before exceptional items 2005 (7.9) (7.9) 8,010.1 (5,173.0) 2,837.1 7,649.6 (4,785.7) 2,863.9 - 7,649.6 (4,785.7) 2,863.9 (2,005.0) (390.7) 24.2 - (181.0) (26.4) 18.9 (19.0) (2,186.0) (417.1) 43.1 (19.0) (1,834.1) (370.7) 17.0 - 4.0 (17.7) (1,834.1) (370.7) 21.0 (17.7) 11.4 484.9 (215.4) 11.4 269.5 14.0 690.1 (13.7) 14.0 676.4 533.0 (37.8) (219.1) 3.7 313.9 (34.1) 740.2 (37.3) 2.7 (16.4) 742.9 (53.7) (10.3) - (10.3) (12.8) - (12.8) (51.6) 13.9 (37.7) - (51.6) 13.9 (37.7) (43.9) 15.2 (28.7) - (43.9) 15.2 (28.7) 447.2 (215.4) 231.8 661.4 (13.7) 647.7 (161.6) 285.6 68.8 (146.6) (92.8) 139.0 (206.5) 454.9 5.3 (8.4) (201.2) 446.5 2005 Continuing operations Revenue Cost of sales Gross profit Selling and distribution expenses Administrative expenses Other income Other expenses Share of post tax results of joint ventures and associates Operating profit 2 2 Analysed as: Retail profit before central costs Central costs Share of joint venture and associate interest and taxation Total finance costs Total finance income Net finance costs 4 Profit before taxation Income tax expense Profit for the year 6 Attributable to: Equity shareholders of the parent Minority interest Earnings per share Basic Diluted 139.5 (0.5) 446.0 0.5 139.0 446.5 6.0 6.0 19.3 19.2 7 The proposed final dividend for 28 January 2006, subject to approval by shareholders at the Annual General Meeting, amounts to £160.0m (2005: £159.7m). Adjusted earnings per share information is provided in note 7. KINGFISHER PLC CONSOLIDATED STATEMENT OF RECOGNISED INCOME AND EXPENSE For the year ended 28 January 2006 Notes 12 12 2006 (45.6) 28.4 2005 (79.3) 59.7 12 12 12 12 7.5 (2.7) 3.2 20.1 10.9 139.0 24.8 5.2 446.5 Total recognised income and expense for the year 149.9 451.7 Attributable to: Equity holders of the parent 149.4 451.6 0.5 0.1 149.9 451.7 (2.2) - - (2.2) - £ millions Actuarial losses on post employment benefits Currency translation differences Cash flow and net investment hedges - Gains deferred in equity - Transferred to income statement in the period - Transferred to initial carrying amount of asset Tax on items taken directly to equity Net income recognised directly in equity Profit for the financial year Minority interests Effect of changes in accounting policy on adoption of IAS 39 Attributable to: Equity holders of the parent Minority interests KINGFISHER PLC CONSOLIDATED BALANCE SHEET As at 28 January 2006 2006 2005 2,558.8 101.7 3,265.0 15.3 185.0 51.7 6,177.5 2,463.1 69.9 3,031.8 18.7 173.7 26.6 5,783.8 1,355.3 570.6 20.7 234.1 2,180.7 8,358.2 1,320.0 453.9 8.8 162.1 1,944.8 7,728.6 (346.8) (1,750.8) (46.6) (77.0) (2,221.2) (40.5) 6,137.0 (184.9) (1,687.9) (10.1) (113.6) (1,255.5) (5.7) (111.4) (204.4) (239.6) (1,816.6) (4,037.8) (818.3) (0.9) (7.7) (192.2) (325.7) (1,344.8) (3,341.3) Net assets 4,320.4 4,387.3 Capital and reserves Share capital Other reserves Minority interests 2,450.0 1,861.0 9.4 2,434.9 1,949.7 4,320.4 4,387.3 £ millions Notes Non-current assets Goodwill Intangible assets Property, plant and equipment Investment property Investments accounted for using equity method Other receivables Current assets Inventories Trade and other receivables Income tax Cash and cash equivalents Total assets Current liabilities Short-term borrowings Trade and other payables Provisions Current tax liabilities Net current liabilities Total assets less current liabilities Non-current liabilities Long-term borrowings Other payables Provisions Deferred income tax liabilities Post employment benefits 13 Total liabilities Total equity 12 (1,996.5) (51.7) 5,732.1 2.7 KINGFISHER PLC CONSOLIDATED CASH FLOW STATEMENT For the year ended 28 January 2006 £ millions Notes 2006 2005 9 304.1 531.5 11 (167.5) 6.5 (2.2) (435.3) (71.7) 111.2 0.4 3.6 4.9 (550.1) (0.4) 10.4 (3.4) 4.8 (387.6) (25.7) 20.9 0.4 2.3 (378.3) (39.3) (6.6) 10.9 9.7 1.7 2.6 373.5 150.5 (7.8) (247.4) 247.8 (37.5) (5.9) 25.2 23.9 18.0 14.0 94.8 (11.3) 7.9 (204.8) (0.7) (76.4) 1.8 76.8 Cash and cash equivalents at beginning of period Currency translation differences 105.9 6.0 28.1 1.0 Cash and cash equivalents at end of year 113.7 105.9 Net cash flows from operating activities Cash flows from investing activities Purchase of subsidiary and business undertakings Cash acquired on purchase of subsidiary undertakings Sale of subsidiary and business undertakings Purchase of associates and joint ventures Sale of associates and joint ventures Payments to acquire property, plant and equipment & investment property Payments to acquire intangible fixed assets Receipts from sale of property, plant and equipment & investment property Receipts from sale of intangible fixed assets Receipts from sale of available for sale financial assets Dividends received from joint ventures and associates Net cash (used) in investing activities Cash flows from financing activities Interest paid Interest element of finance lease rental payments Interest received Exceptional finance receipt Proceeds from issue of share capital Capital injections from minority interests Receipts from the sale of own shares Increase in medium term notes Increase in other loans Capital element of finance lease rental payments Receipts from sale of available for sale financial assets Dividends paid to Group shareholders Dividends paid to minority interests Net cash generated/(used) in financing activities Net cash increase in cash and cash equivalents 10 For the purposes of the cash flow statement, cash and cash equivalents are included net of overdrafts repayable on demand. These overdrafts are excluded from cash and cash equivalents disclosed on the balance sheet. KINGFISHER PLC NOTES TO THE FINANCIAL INFORMATION For the year ended 28 January 2006 1. General information a) Basis of Preparation The consolidated income statement, consolidated balance sheet, consolidated cash flow statement, consolidated statement of recognised income and expense and extracts from the notes to the accounts for 28 January 2006 and 29 January 2005 do not constitute the Group’s Annual Report & Accounts. The auditors have reported on the Group’s statutory accounts for each of the years 2006 and 2005 under section 235 of the Companies Act 1985, which do not contain statements under sections 237 (2) or (3) of the Companies Act and are unqualified. The statutory accounts for 2005 under UK GAAP have been delivered to the Registrar of Companies and the statutory accounts for 2006 will be filed with the Registrar in due course. Copies of the Annual Report & Accounts will be posted to shareholders during the week beginning 17 April 2006. The consolidated financial statements have been prepared in accordance with International Financial Reporting Standards (IFRS) as adopted by the European Union and International Financial Reporting Standards issued by the IASB, and with those part of the Companies Act 1985 applicable to companies reporting under IFRS. All International Financial Reporting Standards issued by the IASB and effective at the time of preparing these consolidated financial statements have been adopted by the EU through the endorsement procedure established by the European Commission. The Group had previously reported under UK GAAP. The disclosures required by IFRS 1 concerning the transition from UK GAAP to IFRS as adopted by the EU are given in note 14. Since the company is not affected by the provisions regarding portfolio hedging that are not required by the EU-endorsed version of IAS 39, the accompanying financial statements comply with both International Financial Reporting Standards as adopted by the European Union and International Financial Reporting Standards issued by the IASB. The consolidated financial statements have been prepared under the historical cost convention, as modified by the revaluation of available for sale investments, financial assets and liabilities (including derivative instruments) held at fair value through the income statement. The clarification of IAS 21 has been adopted in these financial statements. The clarification requires exchange differences arising on a monetary item that forms part of a reporting entity’s net investment in a foreign operation to be recognised initially in a separate component of equity in the consolidated financial statements. This requirement applies irrespective of whether the monetary item results from a transaction with the parent or with any of its subsidiaries. As a result of this clarification, gains and losses on intercompany balances previously recognised in the income statement within net finance costs are no longer recognised in the income statement but rather directly in reserves which offset the equal and opposite amount in reserve movements on consolidation. The impact of this change is a reduction in profit before tax of £12.0m for the year ended 29 January 2005 and a reduction in net assets of £nil at 29 January 2005. With regard to leases that contain predetermined, fixed minimum rental increases, the International Financial Reporting Interpretations Committee (IFRIC) have recently clarified that it is necessary to account for these leases on a straight-line basis over the life of the lease. Formerly, the Group accounted for these property lease rentals such that the increases were charged to the income statement in the year that they arose. This represents a change from the Group’s IFRS information previously announced. The impact of this change is a reduction in profit before tax of £1.7m for the year ended 29 January 2005 and a reduction in net assets of £4.2m at 29 January 2005. The Group has taken the option to defer the implementation of the standards IAS 32 ‘Financial Instruments: Disclosure and Presentation’ and IAS 39 ‘Financial Instruments: Recognition and Measurement’ until the financial year ended 28 January 2006. In accordance with IFRS 1 paragraph 36A comparative information for financial instruments for the year ended 29 January 2005 has been prepared in accordance with UK GAAP. Details of the Group’s accounting policies, as defined under UK GAAP, can be found in the accounting policies note of the annual report and accounts for the year ended 29 January 2005 and in note 15 of these accounts. Details of the accounting policy change are provided in note 15. The Group has chosen to early adopt the EU endorsed Amendment to IAS 19 ‘Employee Benefits – Actuarial Gains and Losses, Group Plans and Disclosures’, the amendments only being mandatory for annual periods beginning on or after 1 January 2006. As a result, actuarial gains and losses are recognised in the statement of recognised income and expense. b) Use of adjusted measures Kingfisher believes that retail profit, adjusted profit before tax, adjusted profit after tax and adjusted earnings per share provide additional useful information on underlying trends to shareholders. These measures are used by Kingfisher for internal performance analysis and incentive compensation arrangements for employees. The terms ‘retail profit’, ‘exceptional item’ and ‘adjusted’ are not defined terms under IFRS and may therefore not be comparable with similarly titled profit measures reported by other companies. It is not intended to be a substitute for, or superior to GAAP measurements of profit. The term ‘adjusted’ refers to the relevant measure being reported excluding exceptional items, financing fair value remeasurements and amortisation of acquisition intangibles. Retail profit is defined as operating profit before central costs (the costs of the Corporate Centre), exceptional items and the Group’s share of joint venture and associate interest and tax. The separate reporting of non-recurring exceptional items, which are presented as exceptional within their relevant consolidated income statement category, helps provide a better indication of the Group's underlying business performance. The principal items that will be included as exceptional items are: non trading items included in operating profit such as profits and losses on the disposal of subsidiaries, associates and investments which do not form part of the Group’s trading activities; gains and losses on the disposal of properties; and the costs of significant restructuring and incremental acquisition integration costs. 2. Segmental analysis The Group’s primary reporting segments are geographic, with the Group operating in four main geographical areas, being the UK, France, Rest of Europe and Asia. The Group only has one business segment being retail sales, therefore no secondary segment disclosure is given. The ‘Rest of Europe’ segment consists of B&Q Ireland, Castorama Poland, Castorama Italy, Castorama Russia, Brico Dépôt Spain, Koçtaş and Hornbach. Poland has been included separately as it meets the reportable segment criteria as prescribed by IAS 14. The ‘Asia’ segment consists of B&Q China, B&Q Korea and B&Q Taiwan. The segment results for the year ended 28 January 2006 are as follows: £ millions External revenue Segment result before joint ventures and associates Share of post tax results of joint ventures and associates Total segment result Unallocated central costs Operating profit United Kingdom France Poland Rest of Europe Asia Total 4,172.0 2,724.9 417.0 378.2 318.0 8,010.1 10.9 10.9 228.9 0.3 229.2 52.5 52.5 20.3 5.5 25.8 (20.4) 5.6 (14.8) 292.2 11.4 303.6 (34.1) 269.5 (37.7) Net finance costs Profit before taxation Income tax expense 231.8 (92.8) Profit for the year 139.0 The segment results for the year ended 29 January 2005 are as follows: £ millions External revenue Segment result before joint ventures and associates Share of post tax results of joint ventures and associates Total segment result Unallocated central costs Operating profit Net finance costs Profit before taxation Income tax expense Profit for the year United Kingdom France Poland Rest of Europe Asia Total 4,277.3 2,546.7 321.9 292.0 211.7 7,649.6 445.0 445.0 209.9 0.7 210.6 46.2 46.2 18.4 9.9 28.3 (3.4) 3.4 - 716.1 14.0 730.1 (53.7) 676.4 (28.7) 647.7 (201.2) 446.5 3. Exceptional items The following are considered to be one-off items which have been charged in arriving at profit before interest and taxation: £ millions 2006 2005 (205.3) (10.0) - (215.3) - 15.3 3.6 3.1 0.9 18.9 4.0 (19.0) - (17.7) (19.0) (17.7) (215.4) (13.7) Included within cost of sales, selling & distribution and administrative expenses: B&Q UK - reorganisation costs OBI China - integration costs Included within other income: Profit on disposal of properties Profit on disposal of available for sale financial assets Included within other expenses: B&Q UK - financial services termination fee Loss on sale of operations Total exceptional items Current year The Group incurred a £205.3 million restructuring charge in B&Q UK relating to the planned closure of 21 stores, the downsizing of a further 16 stores and the costs of streamlining B&Q’s corporate offices . A further charge of £19.0m was incurred following B&Q’s decision to terminate a contract with its current supplier of consumer credit services, which gave rise to the repayment of part of the original proceeds received on disposal of Time Retail Finance in 2003. £10m of costs were also incurred in relation to the integration of the OBI China business into B&Q China. These costs include the incremental costs of the dedicated integration team, re-branding costs and the write-off of property, plant and equipment which were not deemed suitable for the B&Q China business model. The Group disposed of a number of properties during the year giving rise to a profit of £15.3m. The Group also disposed of its investment in improveline.com, for cash consideration of £3.6m and realising a profit of £3.6m as the investment had been fully provided against in a prior year. Prior year During the prior year, the Group provided £17.7m against the remaining balance of the unsecured working capital loan advanced to the purchases of the ProMarkt business as part of the disposal. 4. Finance costs £ millions 2006 Bank and other interest payable 46.7 Less amounts capitalised in the cost of qualifying assets (3.3) 2006 2005 2005 36.7 (3.8) 43.4 32.9 Finance lease charges 6.0 5.9 Net interest charge on pension schemes 3.8 5.1 Financing fair value remeasurements (1.6) - Total finance cost 51.6 43.9 Bank and other interest receivable (13.9) (15.2) Total finance income (13.9) (15.2) 37.7 28.7 Interest payable Net finance costs 5. Dividends £ millions 2006 2005 159.7 143.4 Amounts recognised as distributions to equity holders in the year: Final dividend for the year ended 29 January 2005 of 6.8p per share (31 January 2004: 6.15p per share) Interim dividend for the year ended 28 January 2006 of 3.85p per share (29 January 2005: 3.85p per share) 89.5 89.9 Dividend paid to Employee Share Ownership Plan Trust (ESOP) shares (1.8) (3.1) 247.4 230.2 Proposed final dividend for the year ended 28 January 2006 of 6.8p per share 160.0 The proposed final dividend for the year ended 28 January 2006 is subject to approval by shareholders at the Annual General Meeting and has not been included as a liability in these financial statements. For the 2005 interim dividend, a scrip dividend alternative was offered to shareholders at 1 share for every 80 ordinary shares and was elected for by holders of 520.9 million shares. For the 2004 final dividend, a scrip dividend alternative was offered to shareholders at 1 share for every 47 ordinary shares and was elected for by holders of 86.5 million shares. A cash dividend and the Dividend Reinvestment Plan (DRIP) for the year ended 28 January 2006 has been approved for payment with allotment due on 2 June 2006. The ex-dividend date will be 5 April 2006 and the record date will be 7 April 2006. If shareholders wish to elect for the DRIP for the dividend for the year ended 28 January 2006 and have not already done so, a letter or completed DRIP mandate form must be received by Kingfisher's Registrars, Computershare Investor Services PLC, by 11 May 2006 at the latest. 6. Income tax expense £millions 2006 2005 7.2 (15.8) 280.8 (8.3) (8.6) (0.4) (9.0) 272.5 (156.1) 116.4 86.9 0.2 73.9 0.2 87.1 74.1 20.2 (4.3) (1.2) 13.4 (1.8) (0.9) 14.7 10.7 92.8 201.2 UK corporation tax Current tax on profits for the period Adjustment in respect of prior periods Double taxation relief Foreign tax Current tax on profits for the period Adjustments in respect of prior periods Deferred tax Current year Adjustment in respect of prior periods Attributable to changes in tax rates A tax credit of £68.8m has been recognised in the income statement relating to exceptional items, of which £40.1m is credited against the current year tax charge in relation to the £215.4m net exceptional charge, with the remaining £28.7m credited in respect of prior periods, relating to tax previously provided on exceptional items which is no longer required. 7. Earnings per share Basic earnings per share is calculated by dividing the earnings attributable to ordinary shareholders by the weighted average number of ordinary shares in issue during the year, excluding those held in the Executive Share Option Plan (ESOP) which are treated as cancelled. For diluted earnings per share, the weighted average number of ordinary shares in issue is adjusted to assume conversion of all dilutive potential ordinary shares. These represent share options granted to employees where the exercise price is less than the average market price of the Company’s shares during the year. Supplementary earnings per share figures are presented. These exclude the effects of exceptional items, IAS39 financing fair value, remeasurements and amortisation of acquisition intangibles to allow comparison of underlying trading performance on a consistent basis. Discontinuing operations have not been shown separately as all business is continuing. 2006 2005 Earnings Weighted average number of shares Per share amount Earnings Weighted average number of shares Per share amount £m millions pence £m millions pence 139.5 2,324.7 6.0 446.0 2,307.5 19.3 10.3 - 16.9 (0.1) Diluted earnings per share 139.5 2,335.0 6.0 446.0 2,324.4 19.2 Basic earnings per share 139.5 2,324.7 6.0 446.0 2,307.5 19.3 Basic earnings per share Earnings attributable to ordinary shareholders Effect of dilutive securities Options Effect of non-recurring costs Exceptional items 215.4 9.3 13.7 0.6 Tax impact arising on exceptional items (40.1) (1.7) (5.3) (0.2) (1.6) (0.1) - - 0.5 - - - 0.1 - - - (28.7) (1.2) - Financing fair value remeasurements Tax impact arising on financing remeasurements Amortisation of acquisition intangibles Reversal of prior year exceptional tax charge - Basic - adjusted earnings per share 285.1 2,324.7 12.3 454.4 2,307.5 19.7 Diluted earnings per share 139.5 2,335.0 6.0 446.0 2,324.4 19.2 Effect of non-recurring costs Exceptional items 215.4 9.2 13.7 0.5 Tax impact arising on exceptional items (40.1) (1.7) (5.3) (0.2) (1.6) (0.1) - - Tax impact arising on financing remeasurements 0.5 - - - Amortisation of acquisition intangibles 0.1 - - - (28.7) (1.2) - - 12.2 454.4 Financing fair value remeasurements Reversal of prior year exceptional tax charge Diluted - adjusted earnings per share 8. 285.1 2,335.0 2,324.4 19.5 Operating leases The Group’s operating lease charges were as follows: £millions Land and buildings Plant and equipment Year ended 28 January 2006 275.7 26.0 Year ended 29 January 2005 226.7 22.9 9. Net cash flows from operating activities £ millions Group operating profit 2006 269.5 2005 676.4 Adjustments for: Depreciation of property, plant and equipment and investment property Amortisation of intangible assets Impairment loss on property, plant and equipment and investment property Impairment loss on intangible assets Share based compensation charge Loss on sale of operations Share of post tax results of joint ventures and associates Loss on disposal of property, plant and equipment and investment property* Loss on disposal of intangible assets Profit on disposal of available for sale financial assets Operating cash flows before movements in working capital 149.8 32.0 40.1 7.5 14.1 (11.4) 22.5 2.0 (3.6) 522.5 135.6 23.7 6.7 17.7 (14.6) 2.8 (0.9) 847.4 (33.3) (97.3) 27.3 (135.2) 140.2 (98.3) (246.6) (72.9) 175.2 (4.3) (148.6) 424.2 698.8 (120.1) (167.3) 304.1 531.5 Movements in working capital (excluding the effects of acquisitions and disposals of subsidiaries and exchange differences on consolidation): Increase in inventories Increase in trade and other receivables Increase in trade and other payables Decrease in post employment benefits Increase in provisions Cash generated by operations Income taxes paid Net cash flows from operating activities *Includes £19.6m relating to the B&Q UK restructuring and included within the £205.3m exceptional charge (note 3). 10. Reconciliation of net debt Net debt incorporates the Group’s borrowings (together with related fair value movements of derivatives on the debt), bank overdrafts and obligations under finance leases, less cash and cash equivalents. £ millions Net debt at start of year Net increase in cash and cash equivalents Decrease in available for sale financial assets Amortisation of underwriting and issue costs of new debt Increase in debt and lease financing Currency translation differences and fair value adjustments on financial instruments Net debt at end of year 11. 2006 (841.1) 1.8 (0.5) (516.2) 0.8 2005 (891.4) 76.8 (7.9) (30.4) 11.8 (1,355.2) (841.1) Acquisitions On 30 June 2005, the Group acquired 100 per cent of the issued share capital of OBI Asia Holdings Limited (the name of which was subsequently changed to B&Q Asia Holdings Limited) for cash consideration of £143.5m generating goodwill of £73.9m. OBI Asia Holdings Limited was the parent company of OBI AG’s home improvement retailing operations in China. A number of its subsidiaries have minority interests ranging from 3% to 35%. Kingfisher also acquired the remaining minority interest in two of its B&Q China subsidiaries for cash consideration of £6.8m generating goodwill of £2.7m, and acquired a number of stores in France through either company or business acquisitions for cash consideration of £17.2m, generating goodwill of £13.0m. Total purchase consideration for the above acquisitions amounted to £167.5m with total goodwill arising of £89.6m. All these acquisitions have been accounted for by the acquisition method of accounting. There were no material disposals during the year. There were no material acquisitions or disposals for the year ended 29 January 2005. 12. Reserves The movements in the Group’s consolidated reserves in the year ended 28 January 2006 and the comparative year are summarised as follows: Hedging reserve Translation reserve Nondistributable reserves Retained earnings Total Balance at 1 February 2004 Actuarial losses on post employment benefits Scrip dividend alternative Treasury shares disposed Share-based compensation charge - - 159.0 - 1,550.7 (79.3) 25.4 (13.1) 6.7 1,709.7 (79.3) 25.4 (13.1) 6.7 Currency translation differences - 59.7 - - 59.7 Tax on items taken from/transferred to equity Net gains and losses recognised directly in equity Profit for the year Total recognised income and expense for the year Dividends - (3.6) 56.1 56.1 - - 28.4 (31.9) 446.0 414.1 (230.2) 24.8 24.2 446.0 470.2 (230.2) At 29 January 2005 - 56.1 159.0 1,734.6 1,949.7 (4.4) (4.4) 7.5 (2.7) 3.2 (2.4) 5.6 5.6 - 0.7 56.8 28.4 6.9 35.3 35.3 - 159.0 - 1.5 1,736.1 (45.6) (2.6) 14.0 (0.9) 15.6 (19.5) 139.5 120.0 (247.4) (2.2) 1,947.5 (45.6) (2.6) 14.0 (0.9) 28.4 7.5 (2.7) 3.2 20.1 21.4 139.5 160.9 (247.4) 1.2 92.1 159.0 1,608.7 1,861.0 £ millions First time adoption adjustment in respect of IAS 39 Restated balance at 30 January 2005 Actuarial losses on post employment benefits Treasury shares disposed Share-based compensation charge Share-based compensation - shares awarded Currency translation differences Gains and losses deferred in equity Transferred to income statement in the period Transferred to initial carrying amount of asset Tax on items taken from/transferred to equity Net gains and losses recognised directly in equity Profit for the year Total recognised income and expense for the year Dividends At 28 January 2006 13. Post employment benefits The Group operates a variety of post employment benefit arrangements covering both funded and unfunded defined benefit schemes and funded defined contribution schemes. The most significant are the funded, final salary defined benefit and defined contribution schemes for the Group’s UK employees; however various defined benefit and defined contribution schemes are operated in France, Poland, Italy, China and Korea. In France and Poland, they are retirement indemnity in nature; and in Korea and Italy termination indemnity in nature. The most recent actuarial valuations of plan assets and the present value of the defined benefit obligations were carried out at 28 January 2006. The principal actuarial assumptions and expected rates of return used were as follows: Annual percentage rate Discount rate Salary escalation Rate of pension increases Price inflation 2006 UK Other % % 4.7 4.0 to 6.0 4.3 2.0 to 6.7 2.7 n/a 2.7 2.0 to 2.5 2006 2005 UK Other % % 5.3 4.2 to 5.5 4.3 2.0 to 6.7 2.7 n/a 2.7 2.0 to 2.5 2005 % rate of return UK Other UK Other Equities 7.6 - 7.8 - Bonds 4.2 - 4.7 - Property 5.9 - 6.2 - Other 3.7 4.0 3.7 4.0 Overall expected rate of return 6.1 4.0 6.6 4.0 The overall expected rate of return is effectively a weighted average of the individual asset categories and their inherent expected rates of return. The main financial assumption is the real discount rate, i.e. the excess of the discount rate over the rate of inflation. If this assumption increased/decreased by 0.1%, the UK defined benefit obligation would decrease/increase by approximately £30m, and the annual UK current service cost would decrease/increase by approximately £1.4m. 13. Post employment benefits continued The assumptions for pensioner longevity are based on an analysis of pensioner death trends under the scheme over the period from 1998 to 2004, together with allowances for future improvements to death rates for all members. The specific tables used are the same as those used in the 2004 funding valuation, namely PMA92C2010 for male pensioners, PFA92C2010 (+2 year age rating) for female pensioners. Further allowances for improving longevity are included for members yet to retire. Based on observed trends, the assumed average age at death for current pensioners reaching age 60 is 81.2 for a male and 83.3 for a female. When members who are yet to retire reach age 60, our assumed average age at death is 84.4 for a male and 85.8 for a female. These assumptions will be reviewed following the next funding valuation due no later than as at 31 March 2007. The amounts recognised in the income statement are as follows: £ millions Amounts charged to operating profit: Current service cost Past service cost Total operating charge (note 8) Amounts credited/(charged) to other finance costs: Expected return on pension scheme assets Interest on pension scheme liabilities Net financing cost (note 6) Total charged to income statement UK 2006 Other Total UK 2005 Other Total 33.2 33.2 3.7 3.7 36.9 36.9 33.8 0.5 34.3 3.7 3.7 37.5 0.5 38.0 (58.9) 61.7 2.8 (0.4) 1.4 1.0 (59.3) 63.1 3.8 (51.5) 55.5 4.0 (0.4) 1.5 1.1 (51.9) 57.0 5.1 36.0 4.7 40.7 38.3 4.8 43.1 The amounts recognised in the balance sheet is determined as follows: £ millions Present value of defined benefit obligations Fair value of scheme assets UK (1,420.4) 1,209.8 2006 Other (39.1) 10.1 Total (1,459.5) 1,219.9 UK (1,186.1) 884.0 2005 Other (33.0) 9.4 Total (1,219.1) 893.4 Net liability recognised in the balance sheet (210.6) (29.0) (239.6) (302.1) (23.6) (325.7) Movements in the deficit during the year: £ millions Deficit at start of year Total service cost charged in the income statement (as above) Interest cost Expected return of pension scheme assets (as above) Actuarial gains and losses Contributions paid by employer Exchange differences UK (302.1) (33.2) (61.7) 58.9 (43.2) 170.7 - 2006 Other (23.6) (3.7) (1.4) 0.4 (2.4) 1.6 0.1 Total (325.7) (36.9) (63.1) 59.3 (45.6) 172.3 0.1 UK (228.0) (34.3) (55.5) 51.5 (78.8) 43.0 - 2005 Other (18.3) (3.7) (1.5) 0.4 (0.5) 1.1 (1.1) Total (246.3) (38.0) (57.0) 51.9 (79.3) 44.1 (1.1) Deficit at end of year (210.6) (29.0) (239.6) (302.1) (23.6) (325.7) The analysis of the scheme assets at the balance sheet date is as follows: 2006 £ millions Equities Bonds Property Other Total market value of assets 2005 UK Other Total % of Total UK Other Total % of Total 638.5 449.4 96.7 25.2 10.1 638.5 449.4 96.7 35.3 52% 37% 8% 3% 509.7 262.8 80.2 31.0 9.4 509.7 262.8 80.2 40.4 57% 29% 9% 5% 1,209.8 10.1 1,219.9 100% 884.0 9.4 893.4 100% The pension plans do not hold any other assets than those disclosed above. 14. Explanation of transition to IFRS Kingfisher plc reported under UK GAAP in its previously published financial statements for the year ended 29 January 2005 and this is the first year that the company has presented its financial statements under IFRS. The analysis below shows a reconciliation of net assets and profit as reported under UK GAAP as at 29 January 2005 to the revised net assets and profit under IFRS as reported in these financial statements. A reconciliation of the net assets is provided from UK GAAP to IFRS at the transition date, being 1 February 2004. Previously published IFRS information has been adjusted in accordance with clarification of IAS 21 and recent IFRIC guidance concerning the accounting treatment of fixed minimum rental increases, both of which are described more fully in note 1a. With the exception of these areas, the adjustments set out below are those that were notified to investors in the press release dated 17 March 2005 which is available on www.kingfisher.com. To aid comparability, the UK GAAP numbers presented below have been reformatted using the new IFRS format rather than the previously disclosed UK GAAP format. Reconciliation of the consolidated income statement for the year ended 29 January 2005 £ millions Notes UK GAAP Effect of transition to IFRS Revenue Cost of sales Gross profit (i),(k) 7,649.6 (4,783.3) 2,866.3 (2.4) (2.4) 7,649.6 (4,785.7) 2,863.9 (1,834.4) (363.4) 17.9 (17.7) 27.5 696.2 0.3 (7.3) 3.1 (13.5) (19.8) (1,834.1) (370.7) 21.0 (17.7) 14.0 676.4 747.9 (36.1) 1.0 (16.6) (7.7) (1.2) (1.0) 2.9 740.2 (37.3) (13.7) - (12.8) (12.8) (25.3) (3.4) (28.7) 670.9 (23.2) 647.7 (201.4) 469.5 0.2 (23.0) (201.2) 446.5 UK GAAP Effect of transition to IFRS IFRS 175.8 65.2 (2.5) 238.5 469.5 (79.3) (175.8) (5.5) 27.3 (233.3) (23.0) (79.3) 59.7 24.8 5.2 446.5 Total recognised income and expense for the year 708.0 (256.3) 451.7 Attributable to: Equity holders of the parent Minority interests 707.9 0.1 (256.3) - 451.6 0.1 708.0 (256.3) 451.7 Selling and distribution expenses Administrative expenses Other income Other expenses Share of post tax results of joint ventures and associates Operating profit Analysed as: Retail profit Central costs Acquisition goodwill amortisation (net) Exceptional items Share of joint venture and associate interest and taxation Financing Net finance costs (d),(g),(i) (d),(f),(g) (m) (a),(e) (b) (m) (a),(e) (a),(d),(g) Profit before taxation Income tax expense Profit for the year (a),(e) IFRS Reconciliation of the statement of recognised income and expense for the year ended 29 January 2005 £ millions Actuarial losses on defined benefit pension schemes Gain on revaluation of properties Currency translation differences Tax on items taken directly to equity Net income recognised directly in equity Profit for the financial period Notes (d) (h) 14. Explanation of transition to IFRS continued Reconciliation of consolidated balance sheet as at 1 February 2004 (date of transition to IFRS) £ millions Non-current assets Goodwill Intangible assets Property, plant and equipment Investment property Investments accounted for using equity method Available for sale financial assets Other receivables Current assets Inventories Trade and other receivables Income tax Investments Cash and cash equivalents UK GAAP Effect of transition to IFRS IFRS (b) (c) (c),(g),(h) (h) (b) 2,455.3 2,769.2 12.0 145.7 0.2 25.8 5,408.2 68.2 (37.1) (6.3) 17.0 41.8 2,455.3 68.2 2,732.1 5.7 162.7 0.2 25.8 5,450.0 (k) 1,071.7 491.6 1.4 23.8 144.2 1,732.7 7,140.9 (10.8) 1.2 (13.8) 13.8 (9.6) 32.2 1,060.9 492.8 1.4 10.0 158.0 1,723.1 7,173.1 (267.6) (1,584.5) (79.2) (0.9) (1,932.2) (199.5) (0.8) 122.1 121.3 111.7 (268.4) (1,462.4) (79.2) (0.9) (1,810.9) (87.8) 5,208.7 153.5 5,362.2 (744.2) (0.7) (14.6) (25.1) (17.5) (802.1) (2,734.3) (46.8) (189.1) (221.2) (457.1) (335.8) (791.0) (0.7) (203.7) (246.3) (17.5) (1,259.2) (3,070.1) 4,406.6 (303.6) 4,103.0 2,390.4 2,013.3 2.9 (303.6) - 2,390.4 1,709.7 2.9 4,406.6 (303.6) 4,103.0 Notes (l) (l) Total assets Current liabilities Short-term borrowings Trade and other payables Current tax liabilities Provisions (g) (d),(f),(i),(j) Net current liabilities Total assets less current liabilities Non-current liabilities Long-term borrowings Other payables Deferred income tax liabilities Post employment benefits Provisions (g) (e) (d) Total liabilities Net assets Capital and reserves Share capital Other reserves Minority interests Total equity (d),(e),(h) 14. Explanation of transition to IFRS continued Reconciliation of consolidated balance sheet as at 29 January 2005 £ millions Non-current assets Goodwill Intangible assets Property, plant and equipment Investment property Investments accounted for using equity method Other receivables Current assets Inventories Trade and other receivables Income tax Investments Cash and cash equivalents UK GAAP Effect of transition to IFRS IFRS (b) (c) (c),(g),(h) (h) (b) 2,463.1 3,247.9 22.8 158.3 26.6 5,918.7 69.9 (216.1) (4.1) 15.4 (134.9) 2,463.1 69.9 3,031.8 18.7 173.7 26.6 5,783.8 (k) 1,333.0 451.6 8.8 9.4 152.7 1,955.5 7,874.2 (13.0) 2.3 (9.4) 9.4 (10.7) (145.6) 1,320.0 453.9 8.8 162.1 1,944.8 7,728.6 (184.0) (1,822.7) (113.6) (10.1) (2,130.4) (174.9) (0.9) 134.8 133.9 123.2 (184.9) (1,687.9) (113.6) (10.1) (1,996.5) (51.7) 5,743.8 (11.7) 5,732.1 (772.4) (0.9) (20.8) (17.8) (7.7) (819.6) (2,950.0) (45.9) (171.4) (307.9) (525.2) (391.3) (818.3) (0.9) (192.2) (325.7) (7.7) (1,344.8) (3,341.3) 4,924.2 (536.9) 4,387.3 2,434.9 2,486.6 2.7 (536.9) - 2,434.9 1,949.7 2.7 4,924.2 (536.9) 4,387.3 Notes (l) Total assets Current liabilities Short-term borrowings Trade and other payables Current tax liabilities Provisions (g) (d),(f),(i),(j) Net current liabilities Total assets less current liabilities Non-current liabilities Long-term borrowings Other payables Deferred income tax liabilities Post employment benefits Provisions (g) (e) (d) Total liabilities Net assets Capital and reserves Share capital Other reserves Minority interests Total equity (d),(e),(h) 14. Explanation of transition to IFRS continued Explanation of reconciling items between UK GAAP and IFRS (a) Presentation of joint ventures and associates The presentation of the Group's share of the results of joint ventures and associated undertakings in the Group's consolidated income statement has changed under IFRS. Under UK GAAP the Group's share of joint venture and associated undertaking operating profit, interest and tax were disclosed separately in the consolidated income statement. In accordance with IAS 1 ‘Presentation of Financial Statements’, the results of joint venture and associated undertakings have been presented net of interest and tax as a single line item. There is no effect on the net result for the financial period from this adjustment. (b) Intangible assets - Goodwill IFRS 3 ‘Business Combinations’ requires that negative goodwill is recognised immediately in the income statement as opposed to being amortised. The negative goodwill that arose on the acquisition of the shares in Hornbach has been credited back to opening reserves under IFRS and increases the Group's interest in joint ventures and associates by £19.3m. The removal of the amortisation credit in the year ended 29 January 2005 reduced profit before tax by £1m. The non-amortisation of positive goodwill required under IFRS has no impact as all positive goodwill held was deemed to have an indefinite life under UK GAAP. (c) Intangible assets - Computer software Under UK GAAP all capitalised computer software was included within property, plant and equipment on the balance sheet. Under IFRS, only computer software that is integral to a related item of hardware should be included as property, plant and equipment. All other computer software should be classified as an intangible asset. Accordingly, a net balance sheet reclassification has been made of £68.2m at the opening balance sheet date and £69.9m at 29 January 2005 between property, plant and equipment and intangible assets. There was no impact on the income statement from this reclassification. (d) Post employment benefits Under UK GAAP the Group applied the provisions of SSAP 24 which are significantly different to IAS 19. As disclosed in note 1, the Group has elected to early adopt the amendment to IAS 19 ‘Employment Benefits’ issued by the IASB on 16 December 2004 which allows all actuarial gains and losses to be charged to equity. Other differences include valuing pension scheme assets at bid value as opposed to mid value and the split of the charge to the income statement between operating (service charge) and financing (return on pension scheme assets and interest on pension liabilities). The Group's opening IFRS balance sheet reflects the assets and liabilities of the Group's defined benefit schemes totalling a net liability of £246.3m. The transitional adjustment of £221.2m to opening reserves comprises the reversal of entries in relation to UK GAAP accounting under SSAP 24 less the recognition of the net liabilities of the Group's defined benefit schemes. The incremental charge arising from the adoption of IAS 19 on the Group's income statement in the year ended 29 January 2005 was £6m, being the total of £0.9m to operating profit and £5.1m to net financing charges. The actuarial loss before tax of £79.3m arising in the year ended 29 January 2005 has been recorded in the statement of recognised income and expense. The pension deficit under IFRS at 29 January 2005 was £325.7m. (e) Deferred and current taxes The scope of IAS 12 ‘Income Taxes’ is wider than the corresponding UK GAAP standards, and requires deferred tax to be provided on temporary differences rather than just taxable timing differences as under UK GAAP. As a result, the Group's IFRS opening balance sheet at 1 February 2004 included an additional deferred tax liability of £189.1m. The majority of this adjustment related to the deferred tax provided on the revaluation reserve less the deferred tax asset recognised on the pension deficit at 1 February 2004. The ‘income tax expense’ on the face of the consolidated income statement comprises the tax charge of the Company and its subsidiaries under IFRS. The Group's share of its joint venture and associated undertakings' tax charges is shown as part of the ‘share of post tax result of joint ventures and associates’ within operating profit. (f) Share-based payment IFRS 2 ‘Share-based Payment’ requires that an expense for equity instruments granted is recognised in the income statement based on their fair value at the date of grant, with a corresponding increase in equity. This expense, which is primarily in relation to employee option and performance share schemes, is recognised over the vesting period of the scheme. Under UK GAAP, the income statement charge, if any, was based on the difference between the exercise price and the market price on the date of issue with a corresponding increase in accruals. The Group elected to apply IFRS 2 only to relevant share based payment transactions granted after 7 November 2002. The additional pre-tax charge arising from the adoption of IFRS 2 on the Group's income statement for the year ended 29 January 2005 was £1.8m. The impact from the adoption of this standard is small as the Group ceased offering share options in 2003 and replaced them with deferred shares for which a charge equating to the market value of the deferred shares was recognised under UK GAAP. (g) Capitalisation of building leases IAS 17 ‘Leases’ requires that the land element of leases on land and buildings is considered separately for the purposes of determining whether the lease is a finance or operating lease. A majority of the Group's buildings are on leases of 25 years or less which remain as operating under IFRS. There are a small number of leases greater than 25 years where the building element of the lease has been classified as a finance lease based on the criteria set out in IAS 17. 14. Explanation of transition to IFRS continued As a result, the Group's IFRS opening balance sheet at 1 February 2004 includes additional property, plant and equipment of £30.6m and additional finance lease obligations of £47.7m included within current and non-current borrowings. The main impact on the income statement is that the operating lease payment charged to operating profit under UK GAAP is replaced with a depreciation charge for the asset (in operating profit) and an interest expense charge (in financing costs). Whilst the total charge for a lease over the life of the lease will be the same under UK GAAP and IFRS, the profile of the charge is different, with the charge being more front loaded under IFRS. The net pre-tax impact on the income statement for the year ended 29 January 2005 was a further charge of £1.3m. (h) Valuation of properties The Group has previously applied a policy of annual revaluations of property under UK GAAP. The Group has now elected to treat the revalued amount of operating properties at 1 February 2004 as deemed cost as at that date and will not revalue for accounts purposes in future. The revaluation gain of £175.8m recognised under UK GAAP for the year ended 29 January 2005 was therefore reversed under IFRS. Investment property was previously revalued annually under UK GAAP. Following the disposal of the Chartwell Land investment property portfolio in 2004, the amount of investment property now held by the Group is insignificant. The Group has elected to restate the remaining investment property to historical cost under IFRS. This results in an increased gain on disposal of properties of £2.9m for the year ended 29 January 2005 under IFRS. There are no other material impacts of this change on the income statement. (i) Lease incentives Under UK GAAP, lease incentives were recognised over the period to the first market rent review. Under IFRS (SIC 15), lease incentives are required to be recognised over the entire lease term. As a result, the Group's IFRS opening balance sheet at 1 February 2004 includes additional deferred income of £21.7m and operating profit for the year ended 29 January 2005 was reduced by £4.5m. (j) Post balance sheet events IAS 10 ‘Events after the Balance Sheet Date’ requires that dividends approved after the balance sheet date should not be recognised as a liability at that date as the liability does not represent a present obligation as defined by IAS 37 ‘Provisions, Contingent Liabilities and Contingent Assets’. The final dividend declared in March 2004 in relation to the financial year ended 31 January 2004 of £143.4m was reversed in the opening balance sheet and charged to equity in the year ended 29 January 2005. The final dividend accrued for the year ended 29 January 2005 of £159.7m was reversed in the IFRS balance sheet as at 29 January 2005. (k) Inventories IAS 2 requires the inclusion of certain elements of income from suppliers and other similar items in the cost of inventories which is a more encompassing requirement than UKGAAP. The value of inventories were reduced by £10.8m at 1 February 2004 and £13.0m at 29 January 2005. (l) Cash IAS 7 ‘Cash Flow Statements’ defines cash equivalents as being short-term, highly liquid investments that are readily convertible to known amounts of cash and which are subject to an insignificant risk of changes in value. Cash deposits with a maturity of less than three months have therefore been reclassified at both balance sheet dates as cash. (m) Exceptional items There are no FRS 3 non-operating exceptionals equivalent under IFRS and therefore items not relating to underlying business performance such as property disposal profits and losses are now included within operating profit. See note 1(b) for further information. (n) Significant changes to the cash flow statement under IFRS are as follows: Cash flows reported under IFRS and UK GAAP are defined differently – under IFRS, cash flows, referred to as ‘cash and cash equivalents’, include bank deposits repayable within 3 months. Under UK GAAP, these were treated as short-term deposits. IFRS requires cash flows to be reported under the three headings of operating, investing and financing activities whereas UK GAAP requires cash flows to be reported in greater detail under the nine standard headings, such as taxation and interest. IFRS requires foreign currency translation differences to be included on the face of the cash flow statement in order that opening and closing cash and cash equivalent balances may be reconciled. This is not a requirement under UK GAAP. 15. First time adoption IAS 32 and IAS 39 As explained in note 1a, Kingfisher plc took the option to defer the implementation of IAS 32 and IAS 39 until 30 January 2005. The adoption of IAS 32 ’Financial Instruments: Disclosure and Presentation’ and IAS 39 ’Financial Instruments: Recognition and Measurement’ with affect from 30 January 2005 results in a change in the Group’s accounting policy for financial instruments. The impact of these standards on the Group’s opening balance sheet is shown below. The principal impact of IAS 32 and IAS 39 on the Group’s financial statements relates to the recognition of derivative financial instruments at fair value. Financial assets and financial liabilities that arise on derivatives that do not qualify for hedge accounting are held on the balance sheet at fair value with the changes in value reflected through the income statement. The accounting treatment of derivatives that qualify for hedge accounting depends on how they are designated. The different accounting treatments are explained below. Fair value hedges The Group uses interest rate and cross currency swaps to hedge the exposure to interest rates and currency movements of its issued debt. Under UK GAAP, derivative financial instruments held for hedging were accounted for using hedge accounting and were not recognised at fair value in the balance sheet. Under IAS 39, derivative financial instruments that meet the ‘fair value’ hedging requirements are recognised in the balance sheet at fair value with corresponding fair value movements recognised in the income statement. For an effective fair value hedge, the hedged item is adjusted for changes in fair value attributable to the risk being hedged with the corresponding entry in the income statement. To the extent that the designated hedge relationship is fully effective, the amounts in the income statement offset each other. As a result, only the ineffective element of any designated hedging relationship impacts the financing line in the income statement. Cash flow hedges The Group hedges the foreign currency exposure on inventory purchases. Under UK GAAP, foreign currency derivatives were held off balance sheet. Under IAS 39, derivative financial instruments that qualify for cash flow hedging are recognised on the balance sheet at fair value with corresponding fair value changes deferred in equity. Net investment hedges The gains or losses on the translation of currency borrowings and cross currency swaps used to hedge the Group’s net investments in foreign entities are recognised in equity. Provided the hedging requirements of IAS 39 are met and the hedging relationship is fully effective, this treatment does not differ from UK GAAP. On the adoption of IAS 32 and IAS 39, there is no material impact for the Group of other financial assets and liabilities that are not part of a designated hedge relationship. The adjustments to the opening balance sheet at 30 January 2005 are as follows: Non-current assets Other receivables Current assets Trade and other receivables Current liabilities Trade and other payables Opening balance sheet under IFRS Effect of adoption of IAS 32 and IAS 39 Restated opening position at 30 January 2005 26.6 24.9 51.5 453.9 1.8 455.7 (1,698.0) (17.9) (1,715.9) (818.3) (192.2) (12.7) 1.7 (831.0) (190.5) Non-current liabilities Long-term borrowings Deferred tax liabilities Impact on net assets Translation reserve Hedging reserve Retained earnings Impact on equity (2.2) 56.1 1,949.7 0.7 (4.4) 1.5 (2.2) 56.8 (4.4) 1,951.2
