Statistical Software and Drawing
advertisement
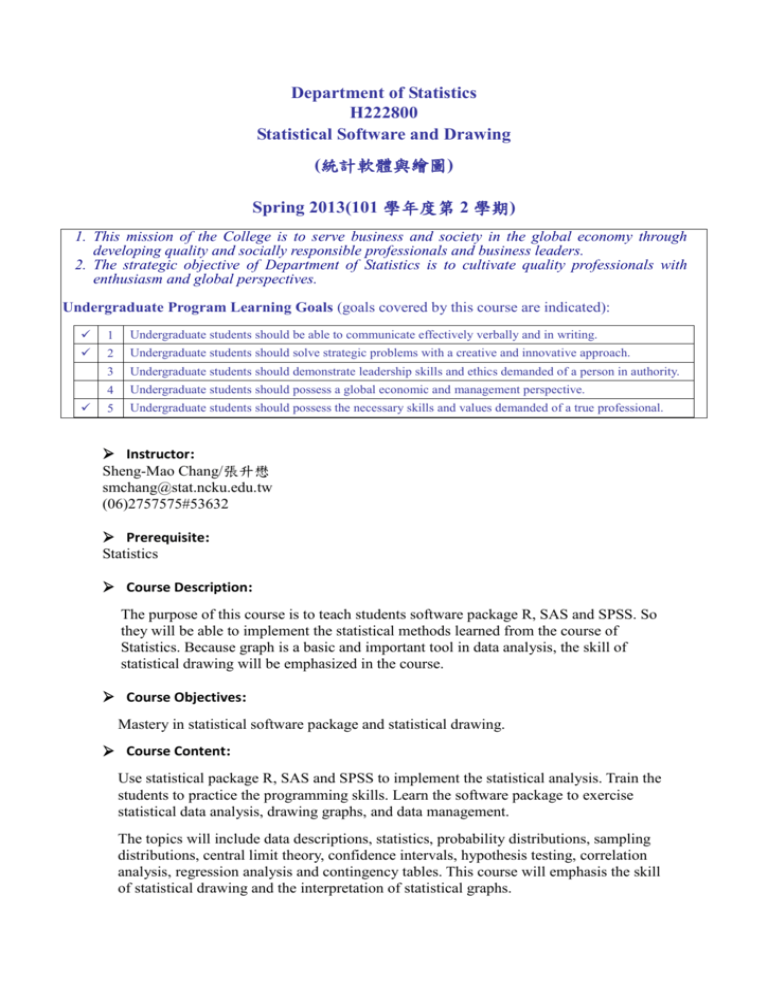
Department of Statistics H222800 Statistical Software and Drawing (統計軟體與繪圖) Spring 2013(101 學年度第 2 學期) 1. This mission of the College is to serve business and society in the global economy through developing quality and socially responsible professionals and business leaders. 2. The strategic objective of Department of Statistics is to cultivate quality professionals with enthusiasm and global perspectives. Undergraduate Program Learning Goals (goals covered by this course are indicated): 1 Undergraduate students should be able to communicate effectively verbally and in writing. 2 Undergraduate students should solve strategic problems with a creative and innovative approach. 3 Undergraduate students should demonstrate leadership skills and ethics demanded of a person in authority. 4 Undergraduate students should possess a global economic and management perspective. 5 Undergraduate students should possess the necessary skills and values demanded of a true professional. Instructor: Sheng-Mao Chang/張升懋 smchang@stat.ncku.edu.tw (06)2757575#53632 Prerequisite: Statistics Course Description: The purpose of this course is to teach students software package R, SAS and SPSS. So they will be able to implement the statistical methods learned from the course of Statistics. Because graph is a basic and important tool in data analysis, the skill of statistical drawing will be emphasized in the course. Course Objectives: Mastery in statistical software package and statistical drawing. Course Content: Use statistical package R, SAS and SPSS to implement the statistical analysis. Train the students to practice the programming skills. Learn the software package to exercise statistical data analysis, drawing graphs, and data management. The topics will include data descriptions, statistics, probability distributions, sampling distributions, central limit theory, confidence intervals, hypothesis testing, correlation analysis, regression analysis and contingency tables. This course will emphasis the skill of statistical drawing and the interpretation of statistical graphs. Textbook: Statistical Analysis and Data Display – An Intermediate Course with Examples in S-Plus, R and SAS , by Richard M. Heiberger & Burt Holland, Springer, 2004. References: R, SAS and SPSS manual。 http://www3.stat.sinica.edu.tw/stat2005w/download/R.pdf http://genetics.agrsci.dk/~sorenh/misc/Rdocs/RFewHours.pdf http://cran.r-project.org/doc/contrib/Verzani-SimpleR.pdf Or download from http://cran.r-project.org Contributed Documentation. Grading Policy: Homework 50%, Class Participation 10%, Final Exam 40%. Grading Policy for AACSB Multiple Assessment: HW 50 % COMMU CPSI LEAD Oral Commu./ Presentation Written Communication Creativity and Innovation Problem Solving Analytical & Computational Skills Leadership & Ethic Social responsibility GLOB Global Awareness VSP Values, Skills & Profess. Information Technology Management Skills Class Participation 10% 50% 50% 20% 20% 20% 50% 20% 20% Final 40% 50%
