Document
advertisement
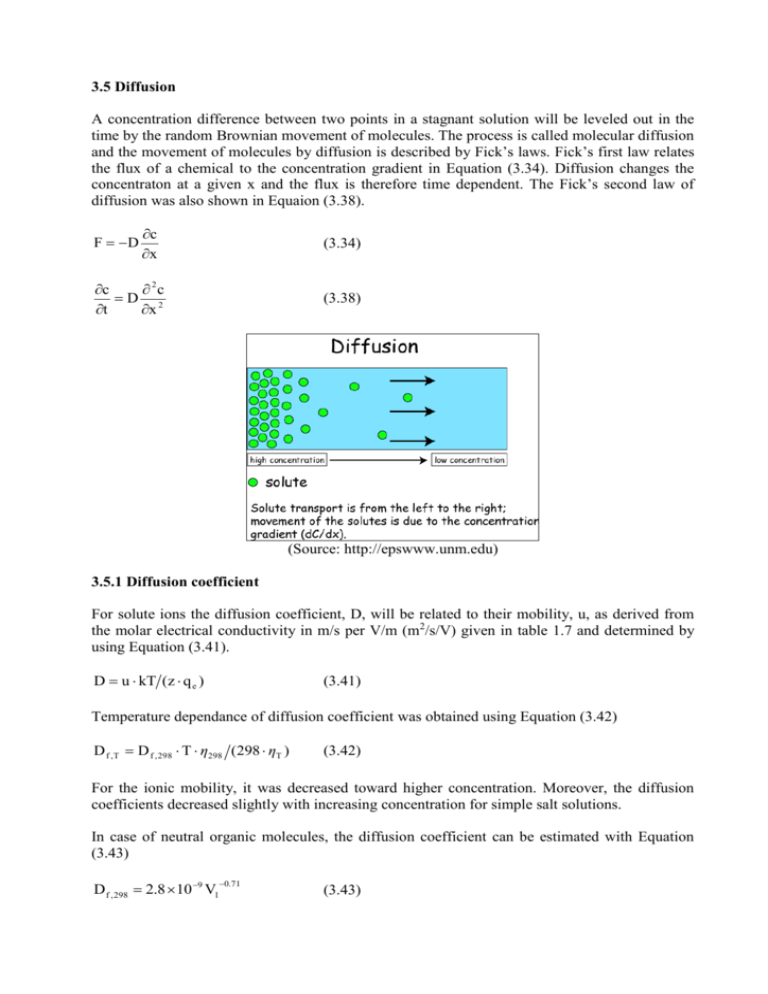
3.5 Diffusion A concentration difference between two points in a stagnant solution will be leveled out in the time by the random Brownian movement of molecules. The process is called molecular diffusion and the movement of molecules by diffusion is described by Fick’s laws. Fick’s first law relates the flux of a chemical to the concentration gradient in Equation (3.34). Diffusion changes the concentraton at a given x and the flux is therefore time dependent. The Fick’s second law of diffusion was also shown in Equaion (3.38). F D c x (3.34) c 2c D 2 t x (3.38) (Source: http://epswww.unm.edu) 3.5.1 Diffusion coefficient For solute ions the diffusion coefficient, D, will be related to their mobility, u, as derived from the molar electrical conductivity in m/s per V/m (m2/s/V) given in table 1.7 and determined by using Equation (3.41). D u kT (z q e ) (3.41) Temperature dependance of diffusion coefficient was obtained using Equation (3.42) D f ,T D f , 298 T η298 (298 ηT ) (3.42) For the ionic mobility, it was decreased toward higher concentration. Moreover, the diffusion coefficients decreased slightly with increasing concentration for simple salt solutions. In case of neutral organic molecules, the diffusion coefficient can be estimated with Equation (3.43) D f , 298 2.8 10 9 Vl 0.71 (3.43) Compared to diffusion in free water, solutes diffusing through a sediment-water system must travel an extra distance because they have to circumnavigate the sediment grains. The effective diffusion coefficient (De) corrected for the additional pathway, which related to the tortuosity (defined as the length of the actual travel path taken by a solute in a porous medium devided by the straight line distance). De Df θ 2 (3.44) Or D e D f ε w (3.47) When applying diffusion coefficient for free water to sediment-water systems, one should remember that only the water filled porosity, ε w , participates in the diffusive flux. 3.5.2 Diffusion as a random process Fick’s second law in Equation (3.38) gives the change of c in space (x) and time (t). By differentiation with respect to t and x, we can verify the integraton of Equation (3.38) yields a solution such as: c At 1 2 x2 exp 4Dt (3.48) Mass conservation of solute at any time t requires: N At 1 2 x2 exp 4Dt dx (3.49) Where A N /( 4πD)1 / 2 , finally n (x) of any solute can be obtained as follow n(x) (x x 0 ) 2 exp 2 2 σ 2πσ 2 N (3.54) Where σ 2Dt for one dimension 3.5.3 Diffusive transport Table 3.4 shows results for different time periods, and for comparison also the traveled distance, L, during the same time, by an advective flow of 10 m/year. It was found that over short time periods diffusive transport equals advective transport, but over longer time periods (and hence also over larger distance) advective flow becomes more and more important. Another integrated form of Fick’s second law can be written as: x (3.58) c( x, t ) c i (c 0 c i )erfc 4D t e 3.5.4 Isotope diffusion (Considering page 96 – 99) 3.6 Dispersion Groundwater flowing through a sand layer is forced to move around the sediment grains. The resulting spreadig of a concenration front is called dispersion. There are two types of dispersion; differences in travel time along flowlines around grains cause longitudinal dispersion (D L), whereas transverse dispersion (DT) is due to stepover onto adjacent flowlines by diffusion. We can still use Fick’s laws to quantify the spreading of concentration fronts. It is also called ARD equation. c c q 2c ν DL 2 t x t x (3.62) The dispersion can be calculated using Equation (3.53) with the difference that x0, the initial location of the point source, is not zero, as for diffusion, but increases with the distance covered bythe moving fluid, i.e. x0 = vt. 3.6.1 Column breakthrough curves When a conservative tracer is injected into a column at concentration c = c0, the front will move with the average water flow velocity throgh the column. At the same time the front disperses. The concentration are found by integrating Equation (3.62) for dq = 0 which becomes: 2c c c ν D L 2 t x x t x t (3.64) Finally, we will get Equation (3.65), which for an infinitely long column, x , and for resident concentration, cr, within the column. c( x , t ) c i x vt (c 0 c i ) (3.65) erfc 4D t 2 L If we instead consider a semi-infinite column from x = 0 o x = , and define a constant concentration boundary at x = 0, the concentration in the column are: c r ( x, t ) c i x vt (c 0 c i ) exp vx erfc D 4D t 2 L L 3.6.2 Dispersion coefficients and disperivity The Peclet number was defined as Pe vd / Df x vt erfc 4 D t L (3.66) 3.6.3 Macrodispersivity The larger spreading in aquifers, compared to laboratory columns, is due to the heterogenous structure of natural sediments with alternating sands of different hydraulic conductivity, and with intercalated layers of clay, silt or gravel. It is no longer the individual grain size, but rather the variation in flow length around low conductivity bodies that determines the dispersivity. This effect is known as macrodispersivity.

