Cellular Manufacturing in Carriage Building Press Shop using by
International Journal of Innovative Technology and Exploring Engineering (IJITEE)
ISSN: 2278-3075, Volume-5 Issue-2, July 2015
Cellular Manufacturing in Carriage Building Press
Shop using by Rank Order Clustering (ROC)
M. Sivakumar, M. Claret Stany, T. Balasubramani
Abstract- Lean manufacturing has proven to be an effective strategy to increase productivity and cost competiveness in the manufacturing industry. Cellular manufacturing (CM) is one of the tool of lean manufacturing. Cellular Manufacturing is one of the initiatives that major businesses in the U.S have been to adopt in order to remain in an increasingly global market. It is a fairly new application of group technology. For effective analysis of existing layout for Carriage Building (CB) press shop and to propose new layout, its needed to examine operation like material travel distance for each part number, machineries used. In order to valid analysis here Clustering techniques are used.
Keywords- Lean manufacturing, Cellular manufacturing.
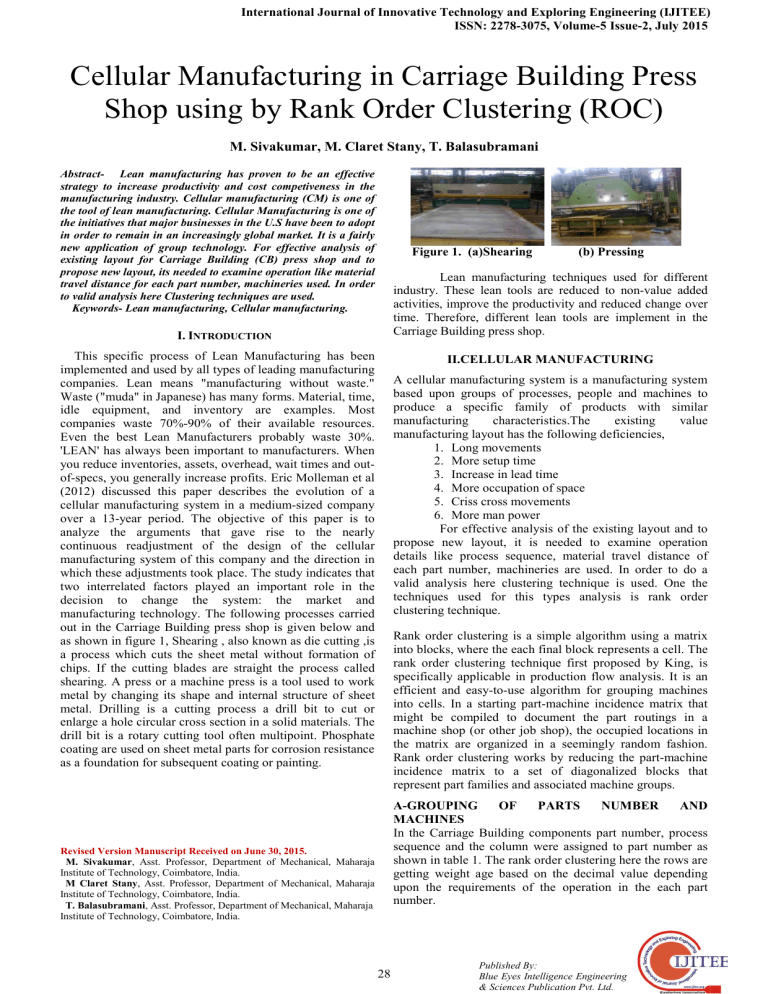
Figure 1. (a)Shearing (b) Pressing
Lean manufacturing techniques used for different industry. These lean tools are reduced to non-value added activities, improve the productivity and reduced change over time. Therefore, different lean tools are implement in the
Carriage Building press shop.
I.
I NTRODUCTION
This specific process of Lean Manufacturing has been implemented and used by all types of leading manufacturing companies. Lean means "manufacturing without waste."
Waste ("muda" in Japanese) has many forms. Material, time, idle equipment, and inventory are examples. Most companies waste 70%-90% of their available resources.
Even the best Lean Manufacturers probably waste 30%.
'LEAN' has always been important to manufacturers. When you reduce inventories, assets, overhead, wait times and outof-specs, you generally increase profits. Eric Molleman et al
(2012) discussed this paper describes the evolution of a cellular manufacturing system in a medium-sized company over a 13-year period. The objective of this paper is to analyze the arguments that gave rise to the nearly continuous readjustment of the design of the cellular manufacturing system of this company and the direction in which these adjustments took place. The study indicates that two interrelated factors played an important role in the decision to change the system: the market and manufacturing technology. The following processes carried out in the Carriage Building press shop is given below and as shown in figure 1, Shearing , also known as die cutting ,is a process which cuts the sheet metal without formation of chips. If the cutting blades are straight the process called shearing. A press or a machine press is a tool used to work metal by changing its shape and internal structure of sheet metal. Drilling is a cutting process a drill bit to cut or enlarge a hole circular cross section in a solid materials. The drill bit is a rotary cutting tool often multipoint. Phosphate coating are used on sheet metal parts for corrosion resistance as a foundation for subsequent coating or painting.
Revised Version Manuscript Received on June 30, 2015.
M. Sivakumar, Asst. Professor, Department of Mechanical, Maharaja
Institute of Technology, Coimbatore, India.
M Claret Stany, Asst. Professor, Department of Mechanical, Maharaja
Institute of Technology, Coimbatore, India.
T. Balasubramani, Asst. Professor, Department of Mechanical, Maharaja
Institute of Technology, Coimbatore, India.
Rank order clustering is a simple algorithm using a matrix into blocks, where the each final block represents a cell. The rank order clustering technique first proposed by King, is specifically applicable in production flow analysis. It is an efficient and easy-to-use algorithm for grouping machines into cells. In a starting part-machine incidence matrix that might be compiled to document the part routings in a machine shop (or other job shop), the occupied locations in the matrix are organized in a seemingly random fashion.
Rank order clustering works by reducing the part-machine incidence matrix to a set of diagonalized blocks that represent part families and associated machine groups.
A-GROUPING OF PARTS NUMBER AND
MACHINES
In the Carriage Building components part number, process sequence and the column were assigned to part number as shown in table 1. The rank order clustering here the rows are getting weight age based on the decimal value depending upon the requirements of the operation in the each part number.
II.CELLULAR MANUFACTURING
A cellular manufacturing system is a manufacturing system based upon groups of processes, people and machines to produce a specific family of products with similar manufacturing characteristics.The existing value manufacturing layout has the following deficiencies,
1.
Long movements
2.
More setup time
3.
Increase in lead time
4.
More occupation of space
5.
Criss cross movements
6.
More man power
For effective analysis of the existing layout and to propose new layout, it is needed to examine operation details like process sequence, material travel distance of each part number, machineries are used. In order to do a valid analysis here clustering technique is used. One the techniques used for this types analysis is rank order clustering technique.
28
Published By:
Blue Eyes Intelligence Engineering
& Sciences Publication Pvt. Ltd.
Cellular Manufacturing in Carriage Building Press Shop using by Rank Order Clustering (ROC)
A.
EXISTING LAYOUT The machineries details of existing layout of CB press shop as shown in table 2.
Table 1 Components part number and part code
PART
NUMBER
5904
5928
5140
COMPONENTS
NAME
BASE CHASSIS
FAN FRAME
CHESSIS
PART CODE
A
B
C
5946
2807
5904
BOTTOM
ZIP FRAME
BOGIE BLATE
SPRING FIXER
D
E
F
The process flow sequences for part no 5904 as shown in figure 1. The existing machines layout (fig.2), material travel distance and its parameters are show in table 3 and 4.
Fig 1 Process flow sequence for part no 5904 Fig.2 existing manufacturing layout
In existing manufacturing layout consists of material travel distance, raw material travel and operator movements are high. If material travel distance reduced, automatically lead time will be increase.
Table 2 Machineries details of existing layout of CB press shop
SL.
NO
Machine No
1 110224003/CB94
2
3
4
5
6
7
8
110224003/CB33
110224001/CB47
110224004/CB/CNC1
110224003/CB78
110224002/CB36
110224001/CB31
110224005/CB/CNC3
Machine
Code
I
II
III
IV
V
VI
VII
VIII
Manufactures Name
PEARSON
UNITED
AMETEEP
SYNCHRO
GODREJ
RUSHWORTHI
RUSHWORTHI
EDWARDS PEARSON
9 110511001/CB12
10 110211003/CN1
IX
X
ACCUMAX
PUSCO
Table 3 Material travel distance for existing layout
Part Code
A
B
C
D
E
F
Material Travel Distance in Meters
53
55
46
43
32
90
Operation
Shearing
Shearing
Shearing
Press Brake
Press Brake
Press Brake
Press Brake
Punching
Press Brake
Drilling
29
Published By:
Blue Eyes Intelligence Engineering
& Sciences Publication Pvt. Ltd.
International Journal of Innovative Technology and Exploring Engineering (IJITEE)
ISSN: 2278-3075, Volume-5 Issue-2, July 2015
Table 4 existing cell layout parameters
SL. NO.
1
2
3
4
4
Parameters
Area used (Sq. meters)
Man power (Nos)
Number of machines (Nos)
Average Material Travel Distance (m)
Raw Material Travel Distance (m)
Metric Value
1400
23
11
53
15
5 Operator Movements (high/Low)
B-RANK ORDER CLUSTERIND TECHNIQUE
In rank order clustering method, it might be helpful to convert each binary value into its decimal equivalent (The
HIGH
It should be mentioned that decimal conversion becomes impractical for the large numbers of parts found in practice, and comparison of the binary numbers is preferred. The rank order clustering iterations are shown in table 5 to 7. entries in the first row of the matrix in Table 5 are read as
100101). This is converted into its decimal equivalent as follows:
(1×2
5
) +(0×2
4
)+(0×2
3
)
+(1×2
2
)+(0×2
1
)+(1×2
0
)=32+0+0+4+0+1=37
Here 1-represents the operation required and 0- represents the operation not required .
Machines
Part No.
I
II
III
IV
V
VI
VII
VIII
IX
X
XI
Table 5 Rank order Cluster analysis for iteration I
1
0
0
0
1
0
1
Rank Order Cluster Analysis For Iteration I
2
5
=32 2
4
=16 2
3
=8 2
2
=4 2
1
=2 2
0
=1
A-5904 B-5928 C-
5140
D-
5916
E-
2807
F-
5904
1
0
0
1
0
1
0
0
0
1
0
0
1
0
0
1
0
0
1
0
1
0
0
0
1
0
1
0
0
1
1
0
0
1
0
0
1
1
0
0
1
0
0
1
1
1
0
0
0
0
0
1
1
1
0
0
0
1
1
Decimal
Value
19
33
28
32
37
24
2
36
32
29
31
Ranking
9
3
7
4
1
8
10
2
5
6
0
Machines
Table 6 Rank order Cluster analysis for iteration II
Rank Order Cluster Analysis for Iteration II
Part No.
A-5904 B-5928 C-5140 D-5916 E-2807 F-5904
Binary Value
I
IV
VI
VIII
IX
X
VII
II
V
III
Binary Value
Ranking
1
0
0
0
1
1
1
1
0
0
992
1
0
1
1
1
0
0
0
0
1
0
28
4
0
1
1
1
0
0
0
0
0
0
28
5
0
1
1
0
1
1
0
0
0
0
792
2
0
0
0
0
0
0
0
0
1
1
3
6
0
1
0
0
1
0
1
0
1
0
658
3
Machines
Table 7 Rank order Cluster analysis for optimum iteration
Part No.
A-5904 D-5916 F-5904 B-5928 C-5140 E-2807
I
IV
VI
VIII
IX
1
1
1
1
1
1
1
0
0
1
1
0
1
0
0
0
0
0
0
0
0
0
0
0
0
0
0
0
0
0
2
9
=512
2
8
=256
2
7
=128
2
6
=64
2
5
=32
2
4
=16
2
3
=8
2
2
=4
2
1
=2
2
0
=1
30
Published By:
Blue Eyes Intelligence Engineering
& Sciences Publication Pvt. Ltd.
Cellular Manufacturing in Carriage Building Press Shop using by Rank Order Clustering (ROC)
VII
II
V
III
X
0
0
0
0
0
0
0
0
0
0
Binary Value
Ranking
992
1
792
2
The various machine layouts are shown in figure 2 to 5 and its parameters are shown in table 8 and 9.
0
0
0
0
0
658
3
1
1
1
0
1
28
4
1
1
0
0
1
28
5
0
0
1
1
1
3
6
Fig.3 Parallel straight layout
Fig.5 Double U cell layout
Table 8 Material in process travel distance for all cell layout
Part
Code
A
B
C
D
E
F
Fig.4 Single U cell layout
Table 9 Cellular layout parameters
Existing layout
Material Travel Distance (m)
Parallel straight
Single U straight
Double U cell
53
55
29
26
29
26
38
16
46
43
32
90
26
44
29
60
26
43
26
51
16
42
18
80
SL.
NO.
3
4
4
5
Parameters
1 Area used (Sq.meters)
2 Man power (Nos)
Number of machines (Nos)
Average Material Travel Distance (m)
Raw Material Travel Distance (m)
Operator Movements (high/Low)
III.RESULTS
Organizes the entire process for a particular product or similar products into a group or cell, including all the necessary machines, equipment and operators. Resources
Existing layout
1400
23
11
53
15
HIGH
Parallel
straight
1012
21
11
36
86
LOW
Single U
straight
1008
21
11
34
75
LOW
Double U cell
1020
20
11
37
25
LOW
Within cells are arranged to easily facilitate all operations.
The various cells layout have been proposed. To compare the various cell parameters and all the cells material travel distance have been grouped in a single graph as shown in
31
Published By:
Blue Eyes Intelligence Engineering
& Sciences Publication Pvt. Ltd.
International Journal of Innovative Technology and Exploring Engineering (IJITEE)
ISSN: 2278-3075, Volume-5 Issue-2, July 2015 figure 6. The double U cell layout have been low material travel distance
MATERIAL IN PROCESS TRAVEL DISDANCE
The double U cell layout has been chosen based on the less area occupancy, less worker movements and rearranged with less cost. The double U cell layout was formed; the machine was arranged on the operation sequence.
100
90
80
70
60
50
40
30
20
10
0
A B C D E
PART CODE
F
CURRENT
MANUFACTURI
NG LAYOUT
PARALLEL
STRAIGHT
LAYOUT
SINGLE U-CELL
LAYOUT
DOUBLE U-CELL
LAYOUT
Fig.6 Material travel distance for various cell layout
MATERIAL TRAVEL DISTANCE in (m)
MATERIAL TRAVEL DISTANCE in Meters
Table 10 Comparison of existing process layout to double U cell layout
Various layout
SL.
NO.
Parameters
1 Area used
(Sq.meters)
2 Man power (Nos)
3 Number of machines (Nos)
4 Average Material
Travel Distance (m)
6 Operator
Movements
(high/Low)
Existing cell layout
Metric
Value
1400
23
11
53
HIGH
Double
U cell
Metric
Value
1020
20
11
37
LOW
It is evident from the table 10 on comparing the parameters of double U cell cellular layout proposed with the old process layout. The following significant improvement has been achieved.
53
36
34
37
IV.
CONCLUSION
The various layouts has been proposed and implementing one double U cell type layout, the following significant improvement has been achieved. The reduction in usage of area by 27.14 % from 1400 to 1020 sq.meters. The man power reduced by 13.04 % from 23 to 20 persons. The material in process travel distance reduced by 30.18 % from
53 to 37 meters.
CURRENT
CELL LAYOUT
PARALLEL
STRAIGHT
SINGLE U
CELL
DOUBLE U
CELL
Fig.7 Material in process average travel distance for
From the below graph for initial implementation and analysis on comparing the parameters of various cells, the double U cell layout is preferred based on the material in process travel distance and raw material travel distance as shown in figure 7 and 8.
100
80
60
40
20
0 various cell layout
RAW MATERIAL TRAVEL DISTANCE
PARALLEL
STRAIGHT
SINGLE U CELL DOUBLE U
CELL
Fig.8 Raw material travel distance for various cell layout
REFERENCE
1.
Christian Becker, Armin Scholl (2006) A survey on problems and methods in generalized assembly line balancing, European Journal of
Operational Research 168 . pp.694–715.
2.
Eric Molleman et al (2012) The evolution of a cellular manufacturing system – a longitudinal case study, Int. J. Production Economics 75
(2002) 305–322.
3.
Fawaz A. Abdulmalek, Jayant Rajgopal (2007) Analyzing the benefits of lean manufacturing and value stream mapping via simulation: A process sector case study, Int. J. Production Economics 107 ,pp.223–
236.
4.
Haeryip sihombing , Kannan rassiah and Parahsakthi chidambaram (
2011) Line balancing analysis of tuner product manufacturing,
International Journal of Engineering Science and Technology (IJEST),
ISSN : 0975-5462, Vol. 3 No. 6 June 2011.
5.
Hosseini Nasab , Aliheidari bioki , H. Khademi Zare (2012) Finding a probabilistic approach to analyze lean manufacturing, Journal of
Cleaner Production 29-30. pp.73-81.
6.
Hubert k Rampersad and anwar EI Homsi (2008) TPS Lean and six sigma book,sara books private limited, value stream mapping, pp.28-33
7.
Kulak, M.B. Durmusoglu, S. Tufekci (2005) A complete cellular manufacturing system design methodology based on axiomatic design principles, Computers & Industrial Engineering 48. pp765–787
8.
Matthias Holweg (2007)The genealogy of lean production, Journal of
Operations Management 25 .pp.420–437.
9.
Mikell P Groover , Automation, production systems and computer integrated manufacturing , third edition,pp. 525-528.
10.
Nils Boysen , Malte Fliedner , and Armin Scholl (2007) A classification of assembly line balancing problems, European Journal of Operational Research 183 . pp.674–693 .
11.
Nuchsara Kriengkorakot ,Nalin Pianthong ( 2007) The Assembly Line
Balancing Problem :Review articles, KKU Engineering Journal Vol. 34
32
Published By:
Blue Eyes Intelligence Engineering
& Sciences Publication Pvt. Ltd.
Cellular Manufacturing in Carriage Building Press Shop using by Rank Order Clustering (ROC)
No .2 , pp.133 – 140
12.
Rachna Shah ,Peter T. Ward (2003) Lean manufacturing: context, practice bundles, and performance, Journal of Operations Management
21, pp.129–149.
13.
Rahani A, Muhammad al-Ashraf (2012) Production Flow Analysis through Value Stream Mapping: A Lean Manufacturing Process Case
Study, Procedia Engineering 41,pp.1727 – 1734.
14.
Ravikumar Marudhamuthu, Marimuthu krishnaswamy,and Damodaran
Moorthy Pillai (2011) The Development and Implementation of Lean
Manufacturing Techniques in Indian garment Industry, JJMIE,
Volume 5, ISSN 1995, pp. 527 – 532.
15.
Sule Itir Satoglu, M. Bulent Durmusoglu ,Ibrahim Dogan (2006)
Evaluation of the conversion from central storage to decentralized storages in cellular manufacturing environments using activity-based costing, Int. J. Production Economics 103 ,pp.616–632.
33
Published By:
Blue Eyes Intelligence Engineering
& Sciences Publication Pvt. Ltd.


