TUBA Application Report - New Generation Transport
advertisement
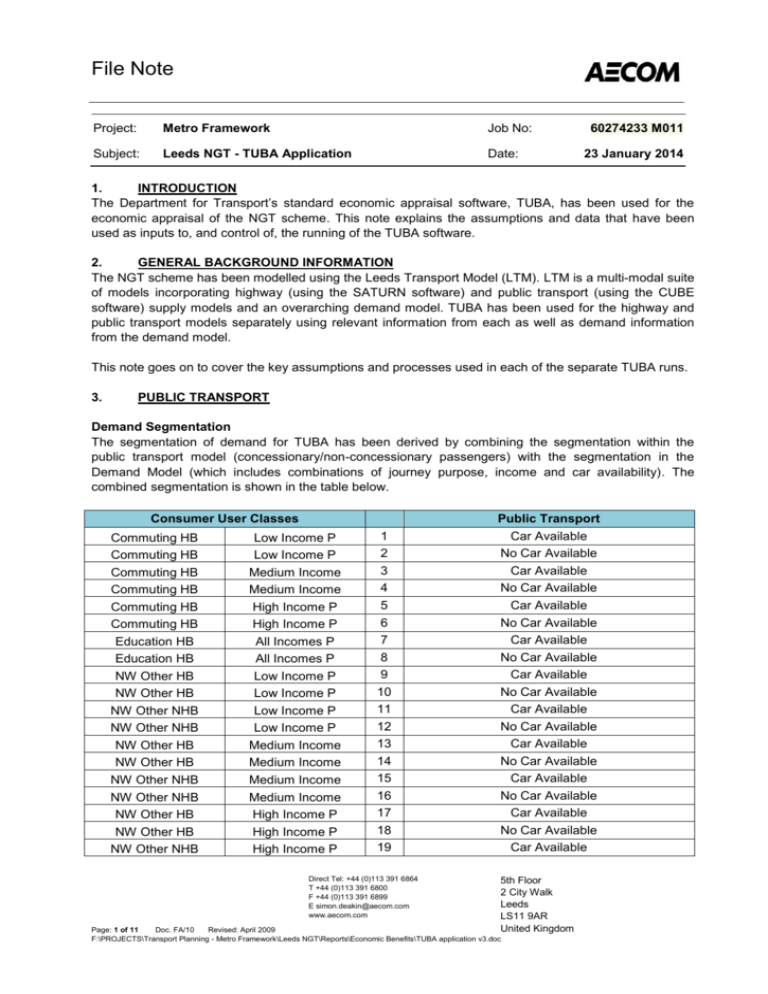
File Note Project: Metro Framework Job No: Subject: Leeds NGT - TUBA Application Date: 60274233 M011 23 January 2014 1. INTRODUCTION The Department for Transport’s standard economic appraisal software, TUBA, has been used for the economic appraisal of the NGT scheme. This note explains the assumptions and data that have been used as inputs to, and control of, the running of the TUBA software. 2. GENERAL BACKGROUND INFORMATION The NGT scheme has been modelled using the Leeds Transport Model (LTM). LTM is a multi-modal suite of models incorporating highway (using the SATURN software) and public transport (using the CUBE software) supply models and an overarching demand model. TUBA has been used for the highway and public transport models separately using relevant information from each as well as demand information from the demand model. This note goes on to cover the key assumptions and processes used in each of the separate TUBA runs. 3. PUBLIC TRANSPORT Demand Segmentation The segmentation of demand for TUBA has been derived by combining the segmentation within the public transport model (concessionary/non-concessionary passengers) with the segmentation in the Demand Model (which includes combinations of journey purpose, income and car availability). The combined segmentation is shown in the table below. Consumer User Classes Commuting HB Commuting HB Commuting HB Commuting HB Commuting HB Commuting HB Education HB Education HB NW Other HB NW Other HB NW Other NHB NW Other NHB NW Other HB NW Other HB NW Other NHB NW Other NHB NW Other HB NW Other HB NW Other NHB Low Income P Low Income P Medium Income Medium Income High Income P High Income P All Incomes P All Incomes P Low Income P Low Income P Low Income P Low Income P Medium Income Medium Income Medium Income Medium Income High Income P High Income P High Income P 1 2 3 4 5 6 7 8 9 10 11 12 13 14 15 16 17 18 19 Direct Tel: +44 (0)113 391 6864 T +44 (0)113 391 6800 F +44 (0)113 391 6899 E simon.deakin@aecom.com www.aecom.com Public Transport Car Available No Car Available Car Available No Car Available Car Available No Car Available Car Available No Car Available Car Available No Car Available Car Available No Car Available Car Available No Car Available Car Available No Car Available Car Available No Car Available Car Available 5th Floor 2 City Walk Leeds LS11 9AR United Kingdom Page: 1 of 11 Doc. FA/10 Revised: April 2009 F:\PROJECTS\Transport Planning - Metro Framework\Leeds NGT\Reports\Economic Benefits\TUBA application v3.doc File Note NW Other NHB High Income P Business User Classes 20 No Car Available Public Transport Commuting HB Commuting HB Education HB Education HB NW Other HB NW Other HB NW Other NHB NW Other NHB Business HB Business HB Business NHB Business NHB 21 22 23 24 25 26 27 28 29 30 31 32 Car Available No Car Available Car Available No Car Available Car Available No Car Available Car Available No Car Available Car Available No Car Available Car Available No Car Available Concessionary Concessionary Concessionary Concessionary Concessionary Concessionary Concessionary Concessionary All Incomes P All Incomes P All Incomes P All Incomes P Appropriate demand matrices have been extracted directly from the demand model in accordance with the demand segmentation specified above and converted to “TUBA3” format. Cost Skims Cost skims were extracted from the CUBE model. The skimming process is carried out at the end of an assignment. The PT model contains a logit sub mode choice model which determines whether or not passengers use NGT based on the composite cost. The cost skims were extracted separately for the four PT model assignment user classes: NGT Non-concessionary passengers; Non NGT non-concessionary passengers; NGT Concessionary passengers; and Non NGT Concessionary passengers The matrices used for input to TUBA are as follows: Demand Composite generalised cost excluding demand-weighted average fare (in time units) Demand-weighted average fare (monetised) The composite generalised cost is used because the choice of route in CUBE public transport assignment includes logit-choice models. It includes the following components: wait times, perceived travel time, perceived, including access and egress times, and including perception of crowding on rail services. boarding penalty transfer penalty for transit modes fares Bus stop quality factors were applied to the model network as additional time incurred when accessing a stop are included as part of the travel time. Direct Tel: +44 (0)113 391 6864 T +44 (0)113 391 6800 F +44 (0)113 391 6899 E simon.deakin@aecom.com www.aecom.com 5th Floor 2 City Walk Leeds LS11 9AR United Kingdom Page: 2 of 11 Doc. FA/10 Revised: April 2009 F:\PROJECTS\Transport Planning - Metro Framework\Leeds NGT\Reports\Economic Benefits\TUBA application v3.doc File Note TUBA guidance sets out a method for introducing a new mode (in this case NGT) which relies on additional model runs at intermediate generalised cost points. Introducing additional model runs and outputs were not practical with a model of the scale and runtime of LTM. Therefore Composite Costs, representing the change in the combined public transport network, was used which provides a reflection of perceived costs and value of choice within the model and is fully consistent with the demand model. TUBA guidance suggests that the PT time costs used for TUBA should be unweighted for business classes. For consumer and other classes, waiting time should be factored by 2.5 and interchanging time (walking and cycling) by 2.0. The reweighting of Composite Cost matrices for TUBA would introduce unacceptable uncertainty about the consistency between the demand model and the appraisal. It was therefore agreed with DfT that an appraisal approach based on behavioural model weightings would be implemented. The weightings used in the PT model for assignment, and subsequently applied in TUBA, were as follows: Walk time = 1.3 Wait factors = 2.85, 2.48 & 2.90 for the AM, IP & PM respectively across all modes Waiting time for transferring passengers is modelled as half the service headway. Initial waiting times are also half the headway for short trips, but are capped at 15 minutes. Time Slices and Annualisation The matrices described above are extracted for the following time periods, in common with the modelled periods in the Public Transport model. AM (average hour 0700-1000) Interpeak (average hour (1000-1600) PM (average hour 1600-1800) Each of these as an annualisation factor associated with it, for the purposes of expanding modelled results from a typical day to annual totals. The annualisation factors used in the TUBA run are derived in the note “Annualisation of Economic Benefits”. These are summarised on the table below: TUBA Time Period Annualisation Factor AM IP PM 772 1543 514 The annualisation factors have been calculated based on 12 hour weekday only flows, and have been applied to the corresponding demand, costs and fares from each modelled period. In order to account for weekend and off peak benefits as series of factors are applied to the inter peak values. These are applied, external to the TUBA run, at a journey purpose level so that the different proportions of journey purposes between these times can be accounted for. The factors and how they are calculated is set out in the Annualisation of Economic Benefits report. Direct Tel: +44 (0)113 391 6864 T +44 (0)113 391 6800 F +44 (0)113 391 6899 E simon.deakin@aecom.com www.aecom.com 5th Floor 2 City Walk Leeds LS11 9AR United Kingdom Page: 3 of 11 Doc. FA/10 Revised: April 2009 F:\PROJECTS\Transport Planning - Metro Framework\Leeds NGT\Reports\Economic Benefits\TUBA application v3.doc File Note HIGHWAY Demand Segmentation The segmentation of demand for TUBA has been based on the segmentation in the Demand Model and shown in the table below. Consumer User Classes Commuting HB Low Income Commuting HB Low Income Commuting HB Medium Income Commuting HB Medium Income Commuting HB High Income Commuting HB High Income Education HB All Incomes Education HB All Incomes NW Other HB Low Income NW Other HB Low Income NW Other NHB Low Income NW Other NHB Low Income NW Other HB Medium Income NW Other HB Medium Income NW Other NHB Medium Income NW Other NHB Medium Income NW Other HB High Income NW Other HB High Income NW Other NHB High Income NW Other NHB High Income Business User Classes Business HB All Incomes Business HB All Incomes Business NHB All Incomes Business NHB All Incomes LGV Business All Incomes OGV1 (% of OGV) All Incomes OGV2 (% of OGV) All Incomes Highway Driver Passenger Driver Passenger Driver Passenger Driver Passenger Driver Passenger Driver Passenger Driver Passenger Driver Passenger Driver Passenger Driver Passenger Highway Driver Passenger Driver Passenger Driver Driver Driver 1 2 3 4 5 6 7 8 9 10 11 12 13 14 15 16 17 18 19 20 21 22 23 24 25 26 27 Appropriate demand matrices have been extracted directly from the demand model in accordance with the demand segmentation specified above and converted to “TUBA3” format. Cost Skims Relevant time and distance skims were extracted from the SATURN model. In this model, just 6 user classes are assigned as follows: Cars – Low Income Cars – Med Income Direct Tel: +44 (0)113 391 6864 T +44 (0)113 391 6800 F +44 (0)113 391 6899 E simon.deakin@aecom.com www.aecom.com 5th Floor 2 City Walk Leeds LS11 9AR United Kingdom Page: 4 of 11 Doc. FA/10 Revised: April 2009 F:\PROJECTS\Transport Planning - Metro Framework\Leeds NGT\Reports\Economic Benefits\TUBA application v3.doc File Note Cars – High Income Cars – Employers Business LGV OGV This means that each of the demand segments identified above needs to be linked to one of the cost/distance skims extracted from the model. For all non-business segments this is done on the basis of income with the exception of classes 7 and 8 relating to education, all incomes. For these segments skims relating to medium incomes are used. For business segments the relationship is clear with demand segments being linked to the relevant car, LGV or HGV skim. The relationship used in the appraisal mirrors that between the highway and demand model. The “SKIM_ALL” process within SATURN has been used providing appropriate path-averaged matrices of time (seconds) and distance (metres) subsequently converted to the required TUBA input of hours and kilometres respectively. The costs skims have been appropriately duplicated for each demand segment and converted to “TUBA3” format for input to TUBA. Time Slices and Annualisation The matrices described above are extracted for the following time periods, in common with the modelled periods in the Highway model. AM1 (0700-0800) AM2 (0800-0900) AM3 (0900-1000) Interpeak (average hour 1000-1600) PM1 (1600-1700) PM2 (1700-1800) PM3 (1800-1900) Each of these as an annualisation factor associated with it, for the purposes of expanding modelled results from a typical day to annual totals. The annualisation factors used in the TUBA run are derived in the note “Annualisation of Economic Benefits”. These are summarised on the table below: TUBA Time Period AM1 AM2 AM3 IP PM1 PM2 PM3 Annualisation Factor 246 245 236 1483 240 237 233 Period Factor 727 1483 709 As with the public transport TUBA application, the highway one only calculates weekday benefits. A series of factors are applied to the inter peak benefits in order to calculate the weekend and off peak values. These are applied, external to the TUBA run, at a journey purpose level so that the different Direct Tel: +44 (0)113 391 6864 T +44 (0)113 391 6800 F +44 (0)113 391 6899 E simon.deakin@aecom.com www.aecom.com 5th Floor 2 City Walk Leeds LS11 9AR United Kingdom Page: 5 of 11 Doc. FA/10 Revised: April 2009 F:\PROJECTS\Transport Planning - Metro Framework\Leeds NGT\Reports\Economic Benefits\TUBA application v3.doc File Note proportions of journey purposes between these times can be accounted for. The factors and how they are calculated is set out in the Annualisation of Economic Benefits report. 4. INFORMATION COMMON TO PUBLIC TRANSPORT AND HIGHWAY ASSESSMENTS Modelled Years and Assessment Period LTM has been run for two forecast years; 2016 and 2031. An assessment period of 60 years beyond the opening year of the scheme has been used. The economic appraisal interpolates/extrapolates this assessment period to represent 60 years of NGT operations. TUBA Control Files TUBA requires two control files: an economics file, containing values of time, vehicle operating cost parameters, forecast changes to these etc. and a scheme file, containing information specific to the scheme being assessed. The economics file has been appropriately modified from the standard default version such that the values and costs for the demand segmentation assumed are correctly reflected. The scheme file have been developed containing specific information as described in this note. This includes: Modelled years and assessment period Time slices User classes Matrix inputs The economics and scheme files used are appended to this note. 5. PARKING To estimate benefit due to the parking model; total person demand, average parking search time, average parking charge and average walk-time to destination have been extracted from the parking model by parking site, time period, trip purpose, and modelled scenario. Average search times, charges and walk-times have then been calculated across all parking sites and person demand summed across parking sites, retaining the time period and trip purpose separation. The rule-of-half has then been applied, calculating (domin demand + test demand)/2 * (test cost – domin cost) for each time period and purpose This has been converted to appropriate units (using person values of time where appropriate), summed over time period and purpose where necessary, and reported as the parking model benefit. 6. DISCUSSION OF ERRORS AND WARNINGS TUBA provides a list of standard warning messages in its output file. These are now discussed. Direct Tel: +44 (0)113 391 6864 T +44 (0)113 391 6800 F +44 (0)113 391 6899 E simon.deakin@aecom.com www.aecom.com 5th Floor 2 City Walk Leeds LS11 9AR United Kingdom Page: 6 of 11 Doc. FA/10 Revised: April 2009 F:\PROJECTS\Transport Planning - Metro Framework\Leeds NGT\Reports\Economic Benefits\TUBA application v3.doc File Note Highway Model Ratio of DM to DS Travel Time This warning is triggered when there are large changes in the travel times from the DM to DS matrices. The following extract from the TUBA Guidance Note shows the ratios at which warnings are triggered. The following two tables summarise the number of origin-destination pairs for which this warning is triggered and the number of DS trips affected. It can be seen that the number of trips affected by serious warnings (i.e. ratio < 0.33 or >3) is small with 81 trips below the limit, no serious warnings occur for above the limit scenario. Below Limit Year Time Slice 2016 1 2 3 4 5 6 7 2031 1 2 3 4 5 6 7 Total SERIOUS Total OD Pairs Total Trips 83 157 93 92 88 91 98 93 179 118 78 133 146 93 1542 WARNING Total OD Pairs Total Trips 1 6 3 4 5 4 2 2 5 5 5 23 6 9 81 Direct Tel: +44 (0)113 391 6864 T +44 (0)113 391 6800 F +44 (0)113 391 6899 E simon.deakin@aecom.com www.aecom.com 1656 2187 1449 4018 1620 1541 1787 1389 1831 1609 2079 1609 1437 1445 25657 5th Floor 2 City Walk Leeds LS11 9AR United Kingdom Page: 7 of 11 Doc. FA/10 Revised: April 2009 F:\PROJECTS\Transport Planning - Metro Framework\Leeds NGT\Reports\Economic Benefits\TUBA application v3.doc 105 233 197 251 170 238 132 105 245 261 235 215 158 248 2794 File Note Above Limit Year 2016 Time Slice 1 2 3 4 5 6 7 2031 1 2 3 4 5 6 7 Total WARNING Total OD Pairs Total Trips 408 8 1091 43 406 9 392 4 435 27 357 24 361 11 639 25 1160 34 642 24 339 6 365 13 801 76 284 6 7680 309 DM and DS Speeds The table below summarises the number of origin-destination pairs across the various combinations of time-slices and journey purposes where a warning concerned with low journey speeds (below 5kph) is triggered. The table presents data for the Do-Minimum and Do-Something scenario, it also indicates the number of trips affected by this error. It is evident from the table that a number of differences exist. Following investigation into this error and analysis undertaken on selected Origin Destination movements, it can be concluded that majority of these errors are located within the urban area of Leeds where slower speeds might be expected. The following chart shows the frequency distribution of trips across the range of speeds (0-5KPH) for the DM and DS scenarios. It can be seen that there is no immediately apparent systematic difference between the distributions for the different scenarios. In general, the overall numbers of trips affected is relatively small and there is no significant change in either the numbers affected or the distribution between the scenarios so no significant impact on the economic assessment is likely. Direct Tel: +44 (0)113 391 6864 T +44 (0)113 391 6800 F +44 (0)113 391 6899 E simon.deakin@aecom.com www.aecom.com 5th Floor 2 City Walk Leeds LS11 9AR United Kingdom Page: 8 of 11 Doc. FA/10 Revised: April 2009 F:\PROJECTS\Transport Planning - Metro Framework\Leeds NGT\Reports\Economic Benefits\TUBA application v3.doc File Note DM Year Time Slice 2016 1 2 3 4 5 6 7 1 2 3 4 5 6 7 2031 Total Total OD Pairs 217 360 90 60 300 354 218 551 834 199 137 525 852 369 5066 DS Total OD Pairs 225 314 98 105 250 355 167 536 770 269 150 585 839 307 4970 Total Trips 24 37 25 27 74 73 42 81 179 63 47 214 235 100 1221 Total Trips 23 35 32 29 60 68 36 81 170 86 43 228 250 86 1228 Further analysis of the distribution of distances within these error messages indicates that over 80% of the trips associated with these slow speeds have trip lengths less than 0.3km. These errors generally occur when two zones are close together and have centroid connectors that either share a node or only Direct Tel: +44 (0)113 391 6864 T +44 (0)113 391 6800 F +44 (0)113 391 6899 E simon.deakin@aecom.com www.aecom.com 5th Floor 2 City Walk Leeds LS11 9AR United Kingdom Page: 9 of 11 Doc. FA/10 Revised: April 2009 F:\PROJECTS\Transport Planning - Metro Framework\Leeds NGT\Reports\Economic Benefits\TUBA application v3.doc File Note need to travel a short distance on the highway network. Where this travel involves going through a congested node the delay at that node has a disproportionate impact on the average speed. Possible Introduction of New Mode TUBA produces a warning when, for a given origin-destination pair one of either the DM time or DS time is 0. This might be indicative of a new mode being introduced which can lead to problems calculating the economic impacts of a scheme. The table below summarises the origin-destination pairs where this problem is identified and the number of occurrences across the various time slice and purpose combinations. These have been investigated in more detail in the Highway Model where it was found that all the identified OD pairs are pairs of adjacent zones connected directly to one another via centroid connectors crossing a node and not making any part of the journey on the network “proper”. This means that they are affected by very small changes in delay at this one node and the small difference in the skims is therefore due to rounding error in the skimming/conversion process (TUBA being limited to 3 decimal places with time input in hours). All time differences are in accordance with this explanation being 0.000 against 0.001 hrs in the DM and DS respectively. This, combined with the small number of OD pairs affected suggests that this will be having a negligible impact on the result of the economic assessment. It is evident from table below, that this error only occurs in the 2016 model scenario, this error does not occur in the 2031 model scenario. Introduction of New Mode Information Year Origin 130 222 2016 132 133 25 21 223 Destination 206 247 Total 27 46 27 27 27 248 54 54 520 2031 Total 527 22 22 22 176 No Errors 25 21 54 54 Long Journey Times In both the DM and DS scenarios there were 798 instances of long journey times flagged up as warnings (i.e. >10hrs). These are legitimate long journey times between distant zones in the model external to the main modelled area. Direct Tel: +44 (0)113 391 6864 T +44 (0)113 391 6800 F +44 (0)113 391 6899 E simon.deakin@aecom.com www.aecom.com 5th Floor 2 City Walk Leeds LS11 9AR United Kingdom Page: 10 of 11 Doc. FA/10 Revised: April 2009 F:\PROJECTS\Transport Planning - Metro Framework\Leeds NGT\Reports\Economic Benefits\TUBA application v3.doc File Note Public Transport Model Ratio of DM to DS Travel Time Ratio of DM to DS travel time lower than limit 34 DM to DS travel time lower than limit for the following were produced indicating an increase in Journey Times. None of the warnings were serious (ratio <0.33). Only 20 trips are associated with the movements where these warnings occur therefore the scale of these impacts will be negligible. Ratio of DM to DS travel time higher than limit A large number of warnings for the ratio being over the time limit (implying a drop in travel times) were produced. There were 11,861 warnings but no serious errors. This result is justifiable since considerable perceived journey time improvements are a result of the NGT scheme (through changes to quality factors etc). An analysis was undertaken of all records where the DS-DM reduction in travel times was greater than 40 minutes. O/D pairs with a reduction in journey time only occurred between long distance destinations from the north of the corridor to the south or vice versa. This seems to be sensible as NGT is likely to provide a direct service where an interchange would have been required on the Do Minimum. Long Journey Times In both the DM and DS scenarios there were 1344 instances of long journey times flagged up as warnings (i.e. >10hrs). These are legitimate long journey times between distant zones in the model external to the main modelled area. Direct Tel: +44 (0)113 391 6864 T +44 (0)113 391 6800 F +44 (0)113 391 6899 E simon.deakin@aecom.com www.aecom.com 5th Floor 2 City Walk Leeds LS11 9AR United Kingdom Page: 11 of 11 Doc. FA/10 Revised: April 2009 F:\PROJECTS\Transport Planning - Metro Framework\Leeds NGT\Reports\Economic Benefits\TUBA application v3.doc
