Concurrent Engineering
advertisement
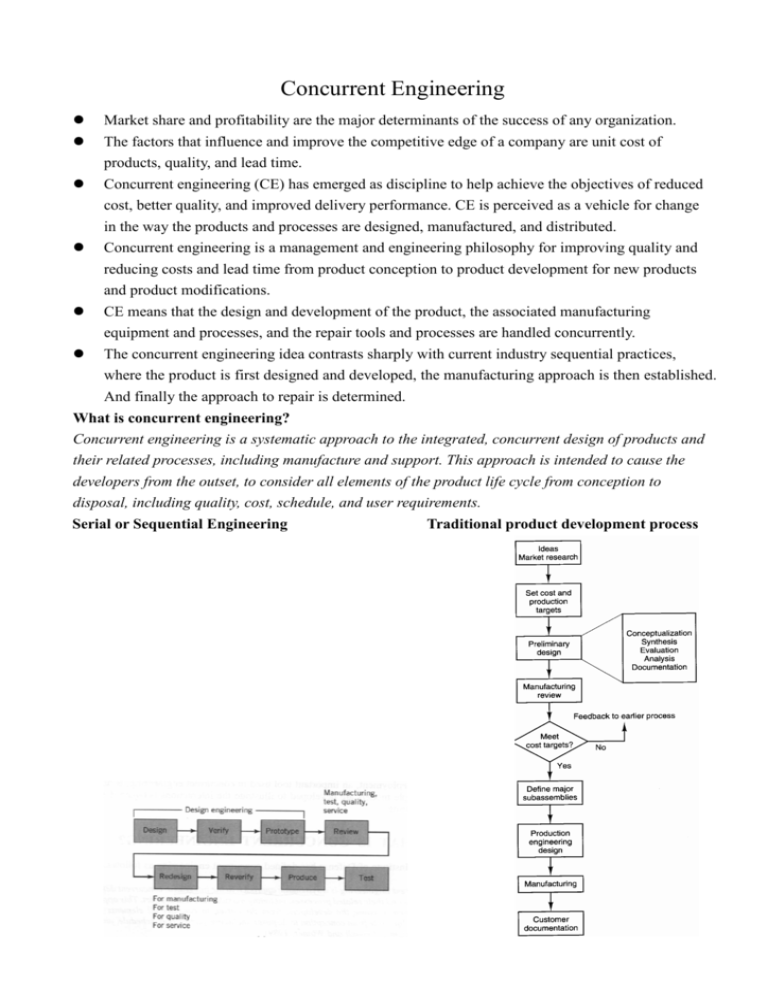
Concurrent Engineering Market share and profitability are the major determinants of the success of any organization. The factors that influence and improve the competitive edge of a company are unit cost of products, quality, and lead time. Concurrent engineering (CE) has emerged as discipline to help achieve the objectives of reduced cost, better quality, and improved delivery performance. CE is perceived as a vehicle for change in the way the products and processes are designed, manufactured, and distributed. Concurrent engineering is a management and engineering philosophy for improving quality and reducing costs and lead time from product conception to product development for new products and product modifications. CE means that the design and development of the product, the associated manufacturing equipment and processes, and the repair tools and processes are handled concurrently. The concurrent engineering idea contrasts sharply with current industry sequential practices, where the product is first designed and developed, the manufacturing approach is then established. And finally the approach to repair is determined. What is concurrent engineering? Concurrent engineering is a systematic approach to the integrated, concurrent design of products and their related processes, including manufacture and support. This approach is intended to cause the developers from the outset, to consider all elements of the product life cycle from conception to disposal, including quality, cost, schedule, and user requirements. Serial or Sequential Engineering Traditional product development process Concurrent Engineering New model for product design Why concurrent engineering? Increasing product variety and technical complexity that prolong the product development process and make it more difficult to predict the impact of design decisions on the functionality and performance of the final product. Increasing global competitive pressure that results from the emerging concept of reengineering. The need for rapid response to fast-changing consumer demand. The need for shorter product life cycle. Large organizations with several departments working on developing numerous products at the same time. New and innovative technologies emerging at a very high rate, thus causing the new product to be technological obsolete within a short period. A characteristic curve representing cost incurred and committed during the product life cycle Summarized the results of a survey that include the following improvements to specific product lines by the applications of concurrent engineering. 1. Development and production lead times 2. Measurable quality improvements 3. Engineering process improvements 4. Cost reduction 1. Development and production lead times Product development time reduced up to 60%. Production spans reduced 10%. AT&T reduced the total process time for the ESS programmed digital switch by 46% in 3 years. Deere reduced product development time for construction equipment by60%. ITT reduced the design cycle for an electronic countermeasures system by33% and its transition-to-production time by 22%. 2. Measurable quality improvements Yield improvements of up to four times. Field failure rates reduced up to 83%. AT&T achieved a fourfold reduction in variability in a polysilicon deposition process for very large scale integrated circuits and achieved nearly two orders of magnitude reduction in surface defects. AT&T reduced defects in the ESS programmed digital switch up to 87% through a coordinated quality improvement program that included product and process design. Deere reduced the number of inspectors by two-thirds through emphasis on process control and linking the design and manufacturing processes. 3. Engineering process improvements Engineering changes per drawing reduced up to 15 times Early production engineering changes reduced by 15%. Inventory items stocked reduced up to 60%. Engineering prototype builds reduced up to three times. Scrap and rework reduced up to 87%. 4. Cost reduction McDonnell Douglas had a 60% reduction in life-cycle cost and 40% reduction in production cost on a short-range missile proposal. Boeing reduced a bid on a mobile missile launcher and realized costs 30 to 40% below the bid. IBM reduced direct costs in system assembly by 50%. ITT saved 25% in ferrite core bonding production costs Summary The customer is consulted during the early product development process; therefore, the product can meet the expectations of the customer. Improved design quality. The lower the number of design changes, the more robust the design of the product is. Reduced product development and design times by listing the voice of the customer and the information between various departments involved. Reduced product cost - reduction in the number of design changes and reduce cost. Elimination of delays Reduced design time and effort Increasing reliability and customer satisfaction. Schemes for CE CE is the application of a mixture of all following techniques to evaluate the total life-cycle cost and quality. 1. Axiomatic design 2. Design for manufacturing guidelines 3. Design science 4. Design for assembly 5. The Taguchi method for robust design 6. Manufacturing process design rules 7. Computer-aided DFM 8. Group technology 9. Failure-mode and effects analysis 10. Value engineering 11. Quality function deployment Examples of design axioms for optimization Axioms have the fundamental properties that (1) they cannot proven and (2) they are general truths 1. Minimize the number of functional requirements and constraints 2. Satisfy the functional requirements from most important first to least important last 3. Minimize information content 4. Everything being equal, conserve materials 5. Integrate functional requirements in a single part if they can be independently satisfied in the proposed solution 6. There may be several optimum solution DFM Guidelines 1. Design for a minimum number of parts 2. Develop a modular design 3. Minimize part variations 4. Design parts to be multifunctional 5. Design parts for multiuse 6. Design parts for ease of fabrication 7. Avoid separate fasteners 8. Minimize assembly directions; design for top-down assembly 9. Maximize compliance; design for ease of assembly 10. Minimize handling; design for handling presentation 11. Evaluate assembly methods 12. Eliminate adjustments 13. Avoid flexible components; they are difficult to handle 14. Use parts of known capability 15. Allow for maximum intolerance of parts 16. Use known and proven vendors and suppliers 17. Use parts at de-rated values with no marginal overstress 18. Minimize subassemblies 19. Use new technology only when necessary 20. Emphasize standardization 21. Use the simplest possible operations 22. Use operations of known capability 23. Minimize setups and interventions 24. Undertake engineering changes in batches The use of DFM guidelines in Nippondenso radiator design Develop a modular design Minimize part variations Design parts for multiuse Use the simplest possible operations Design for Assembly (Xerox latch mechanism design) Mathematical Model for Understanding Integration between Design and Manufacturing The mathematical model serves as a decision support system integrating issues related to design and manufacturing and helps address the following questions: 1. How does design affect manufacturing cost, quality, and manufacturing lead time? 2. What is the influence of manufacturing process design on these factors? 3. How does the concurrent engineering approach help obtain a better solution compared with the serial engineering approach? Answer of these questions: Consider a simple product, a cylindrical part (shaft). The design stage is concerned with specifying tolerances on the shaft. The manufacturing stage is essentially a transformation process, changing a bar stock into a finished shaft meeting tolerance specifications. The process involves a turning operation that can be performed on a turret lathe, an engine lathe, an automatic screw machine, or a numerically controlled turning center. The transformation process indicates inputs, outputs and rejects, and presents as a normal distribution. Suppose the design department specifies the tolerance limits to meet certain function requirements. Let tuk and tlk represent the upper and lower tolerance limits, respectively, for a component shaft for the kth alternative system of tolerances. Also, let j, and j be the standard deviation and the process mean of the output dimension of the shaft, respectively, for the jth manufacturing option. Assuming that the dimensions are normally distributed, the standard normal variates for the upper and lower tolerance limits can be written as: t ku j j t kl j j Z ujk Z ljk *for the kth alternative system of tolerances using the jth manufacturing option. Let Yojk, Yijk and Ysjk represent the output, input, and scrap units, respectively. Then , at the transformation stage using the jth machining process, we have the fraction of scrap (SCjk) as follows: Ys SC jk jki Z ljk 1 Z ujk Y jk Where ( ) represents the cumulative density function of the standard normal variate. At the transformation stage we have the mass balance equation Yijk = Yojk + Ysjk The technological coefficients per unit output : Y jki K o Y jk i jk Y jks K o Y jk s jk Material Balance Equations At a transformation process, the dollar inflow rate equals the dollar outflow rate, If Xijk, Xojk, and Xsjk are unit average cost of input, output, and scrap, respectively. And f(Yijk) is the processing cost per unit. i i i i o o s s X jk Y jk Y jk f Y jk X jk Y jk X jk Y jk Or X ojk K ijk X ijk K sjk X sjk K ijk f (Y jki ) Average Manufacturing Lead Time If the average processing time per unit using the jth manufacturing technology is tj and Sj is the setup time, then the average manufacturing lead time to produce Yojk finished units meeting specifications is Tj = Sj + tj KIjk Yojk Example for Serial Engineering vs. Concurrent Engineering: ABC Company requires 1000 units of a turned cylindrical part (shaft). The design department of ABC company defines a need for a cylindrical part to be finished to 1 0.003 inch. A serial engineering approach and a concurrent engineering solution are presented in the two scenarios that follow. We compare two situations that emerge from these strategies. Serial Engineering Approach The design department of ABC recommends a shaft dimension and tolerance of 1 0.003 inch; this information is transmitted to the manufacturing engineering department. In the serial engineering approach, manufacturing engineering accepts these specifications and attempts to find the best manufacturing technology to accommodate the request made by design. Manufacturing engineering will challenge the specification only if the design is not producible. Drawing on the preceding analysis, manufacturing engineering decides to produce the parts on a turret lathe because the desired tolerances can be obtained. The process average and the standard deviation are estimated to be 1.00 and 0.003 inch, respectively. Other relevant data are: Understanding benefits of concurrent engineering Quality Function Deployment (QFD) The main objective of a manufacturing company is to bring new products to market sooner than the competition with lower cost and improved quality. The mechanism for doing is called QFD. QFD provides a means of translating customer requirements into appropriate technical requirements for each stage of product development and production, that is, marketing strategy, planning, product design and engineering, prototype evaluation, production process development, production, and sales. There are four phases of QFD 1. Product planning phase 2. Part deployment phase 3. Process deployment phase 4. Production deployment phase Product planning phase In this phase, the overall customer requirements drawn from market evaluations, comparison with competitors, and market plans are converted into specified final product control characteristics. Product Planning Matrix Step 1. State requirements in customer terms. The primary customer requirements are expanded into secondary and tertiary requirements to obtain a more definite list. This information is obtained from a variety of sources, such as marketing research data, dealer input, sales department wants, and special customer surveys. Step 2. List the final product control characteristics that should meet the customer-stated product requirements. These characteristics are the product requirements that are related directly to the customer requirements and must be selectively deployed throughout the design, manufacturing, assembly, and service process to manifest themselves in the final product performance and customer acceptance. Step 3. Develop a relationship matrix between customer requirements and final product control characteristics. A set of symbols is used to represent the relationships, such as strong, medium, and weak relationships. If the matrix shows a majority of "weak relationship" signs, it is an indication that some customer requirements are not addressed properly. Step 4. Enter market evaluations. The objective is to evaluate the strengths and weaknesses of the products vs. the competitions so that areas for improvement are clearly identifies. Step 5. Enter product control characteristic competitive evaluations and compare control characteristic competitive evaluations with market competitive evaluations. This helps indicate inconsistencies between customer requirements and your own evaluations. Step 6. Determine selling points for new product. Based on these points, product marketing, distribution, and promotion strategies are decided. Step 7. Develop measurable targets for final product control characteristics based on agreed-upon selling points, the customer importance index, and the current product strengths and weaknesses. Step 8. Select control characteristics based on customer importance, selling points, and competitive evaluations. These selected characteristics must be translated into the language of each discipline in terms of actions and controls required to ensure that the customer's voice is heard through every stage of the product life cycle. Part deployment phase In this phase, the output of the product planning (i.e. final product control characteristics) is translated into critical component characteristics. This phase is the first step in materializing the customer needs and a one step forward into the design and assembly process development. For this purpose, a document called the final product characteristic deployment matrix is used. In this matrix, the final product control characteristics are carried from the final assembly (product) level to the subsystem/component. From the customer requirements and final product control are identified. Process deployment phase In this phase, all the critical product and process parameters are identified and quality control checkpoints for each parameter are established. If a critical product component parameter is created or directly affected in a given step of a process, that parameter is identified as a control point. These points establish the data and strategy for the product quality control plan and are essential for achieving product characteristics that meet the high-priority customer requirements. If critical parameters, such as time, temperature, and pressure, must be monitored to ensure that the component parameters are achieved, these parameters are designed as checkpoints and become the basis for operating instructions and the process control strategy. Production deployment phase The output from the process development and quality control planning phase provides the critical product and process parameters. The objective of the production operating instruction phase is to identify the operations to ensure that these parameters are achieved. The operating instructions sheet is the fourth and final key QFD document. It basically defines the operator requirements as determined by the actual process requirements, the process plan chart checkpoint, and the quality control plan chart control points. Many variations in the operating instructions can be anticipated based on individual process situations. What is important is that this document, which relates to the checkpoints and control points, clearly conveys the following points to the operator: What parts are involved? How many should he or she check, using what tool? How should the check be made? Cumulative Standard Normal Distribution
