Release date 09-28-2012
Page 1 of 4
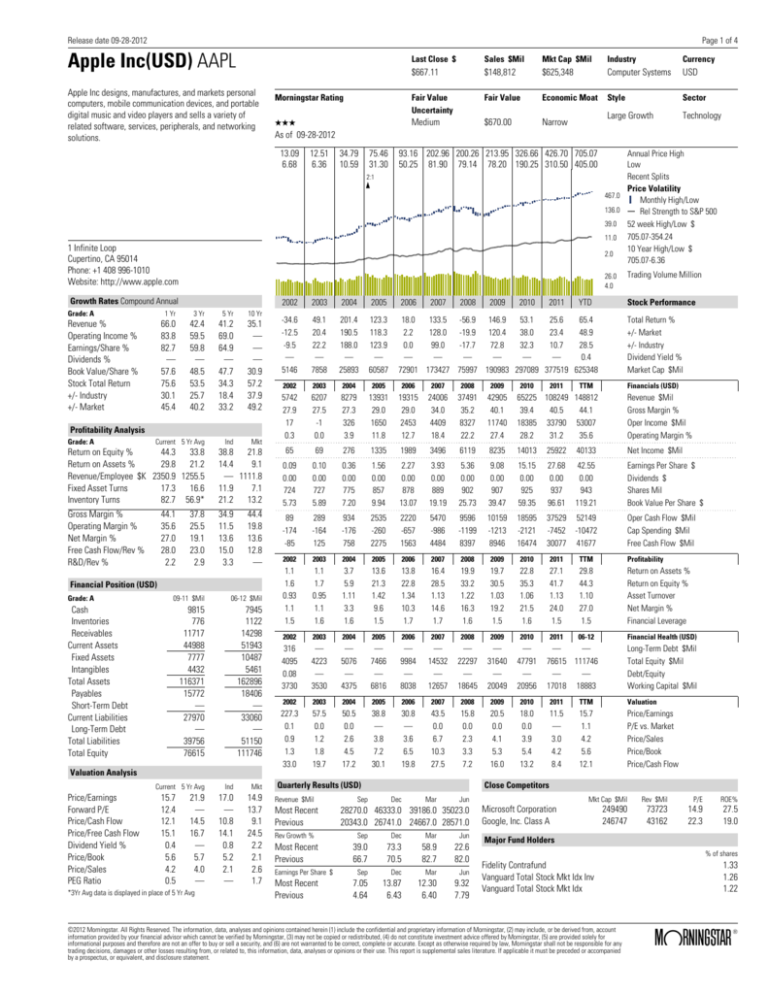
Apple Inc(USD) AAPL
Apple Inc designs, manufactures, and markets personal
computers, mobile communication devices, and portable
digital music and video players and sells a variety of
related software, services, peripherals, and networking
solutions.
Morningstar Rating
QQQ
As of 09-28-2012
13.09
6.68
12.51
6.36
34.79
10.59
75.46
31.30
Last Close $
Sales $Mil
Mkt Cap $Mil
Industry
Currency
$667.11
$148,812
$625,348
Computer Systems
USD
Fair Value
Uncertainty
Fair Value
Economic Moat
Style
Sector
Medium
$670.00
Large Growth
Technology
Narrow
93.16 202.96 200.26 213.95 326.66 426.70 705.07
50.25 81.90 79.14 78.20 190.25 310.50 405.00
2:1
1 Infinite Loop
Cupertino, CA 95014
Phone: +1 408 996-1010
Website: http://www.apple.com
26.0
4.0
Growth Rates Compound Annual
Grade: A
Revenue %
Operating Income %
Earnings/Share %
Dividends %
Book Value/Share %
Stock Total Return
+/- Industry
+/- Market
1 Yr
3 Yr
5 Yr
10 Yr
66.0
83.8
82.7
—
57.6
75.6
30.1
45.4
42.4
59.5
59.8
—
48.5
53.5
25.7
40.2
41.2
69.0
64.9
—
47.7
34.3
18.4
33.2
35.1
—
—
—
30.9
57.2
37.9
49.2
Ind
Mkt
Profitability Analysis
Grade: A
Current 5 Yr Avg
Return on Equity %
44.3
33.8
Return on Assets %
29.8
21.2
Revenue/Employee $K 2350.9 1255.5
Fixed Asset Turns
17.3
16.6
Inventory Turns
82.7 56.9*
38.8
21.8
14.4
9.1
— 1111.8
11.9
7.1
21.2
13.2
Gross Margin %
Operating Margin %
Net Margin %
Free Cash Flow/Rev %
R&D/Rev %
34.9
11.5
13.6
15.0
3.3
44.1
35.6
27.0
28.0
2.2
37.8
25.5
19.1
23.0
2.9
44.4
19.8
13.6
12.8
—
Financial Position (USD)
Grade: A
09-11 $Mil
06-12 $Mil
9815
776
11717
44988
7777
4432
116371
15772
—
27970
—
39756
76615
7945
1122
14298
51943
10487
5461
162896
18406
—
33060
—
51150
111746
Cash
Inventories
Receivables
Current Assets
Fixed Assets
Intangibles
Total Assets
Payables
Short-Term Debt
Current Liabilities
Long-Term Debt
Total Liabilities
Total Equity
Valuation Analysis
Current 5 Yr Avg
Price/Earnings
Forward P/E
Price/Cash Flow
Price/Free Cash Flow
Dividend Yield %
Price/Book
Price/Sales
PEG Ratio
15.7
12.4
12.1
15.1
0.4
5.6
4.2
0.5
Annual Price High
Low
Recent Splits
Price Volatility
467.0
Monthly High/Low
136.0
Rel Strength to S&P 500
39.0 52 week High/Low $
11.0 705.07-354.24
10 Year High/Low $
2.0
705.07-6.36
21.9
—
14.5
16.7
—
5.7
4.0
—
*3Yr Avg data is displayed in place of 5 Yr Avg
Ind
Mkt
17.0
—
10.8
14.1
0.8
5.2
2.1
—
14.9
13.7
9.1
24.5
2.2
2.1
2.6
1.7
2002
2003
2004
2005
2006
2007
2008
2009
2010
2011
-34.6
-12.5
-9.5
—
5146
49.1
20.4
22.2
—
7858
201.4
190.5
188.0
—
25893
123.3
118.3
123.9
—
60587
18.0
133.5 -56.9 146.9
53.1
25.6
65.4
2.2
128.0 -19.9 120.4
38.0
23.4
48.9
0.0
99.0
-17.7
72.8
32.3
10.7
28.5
—
—
—
—
—
—
0.4
72901 173427 75997 190983 297089 377519 625348
2010
2011
YTD
Trading Volume Million
Stock Performance
Total Return %
+/- Market
+/- Industry
Dividend Yield %
Market Cap $Mil
2002
2003
2004
2005
2006
2007
2008
2009
5742
27.9
17
0.3
6207
27.5
-1
0.0
8279
27.3
326
3.9
13931
29.0
1650
11.8
19315
29.0
2453
12.7
24006
34.0
4409
18.4
37491
35.2
8327
22.2
42905
40.1
11740
27.4
65225 108249 148812
39.4
40.5
44.1
18385 33790 53007
28.2
31.2
35.6
TTM
Financials (USD)
Revenue $Mil
Gross Margin %
Oper Income $Mil
Operating Margin %
65
69
276
1335
1989
3496
6119
8235
14013
25922
40133
Net Income $Mil
0.09
0.00
724
5.73
0.10
0.00
727
5.89
0.36
0.00
775
7.20
1.56
0.00
857
9.94
2.27
0.00
878
13.07
3.93
0.00
889
19.19
5.36
0.00
902
25.73
9.08
0.00
907
39.47
15.15
0.00
925
59.35
27.68
0.00
937
96.61
42.55
0.00
943
119.21
Earnings Per Share $
Dividends $
Shares Mil
Book Value Per Share $
89
-174
-85
289
-164
125
934
-176
758
2535
-260
2275
2220
-657
1563
5470
-986
4484
9596
-1199
8397
10159
-1213
8946
18595
-2121
16474
37529
-7452
30077
52149
-10472
41677
Oper Cash Flow $Mil
Cap Spending $Mil
Free Cash Flow $Mil
2002
2003
2004
2005
2006
2007
2008
2009
2010
2011
TTM
Profitability
1.1
1.6
0.93
1.1
1.5
1.1
1.7
0.95
1.1
1.6
3.7
5.9
1.11
3.3
1.6
13.6
21.3
1.42
9.6
1.5
13.8
22.8
1.34
10.3
1.7
16.4
28.5
1.13
14.6
1.7
19.9
33.2
1.22
16.3
1.6
19.7
30.5
1.03
19.2
1.5
22.8
35.3
1.06
21.5
1.6
27.1
41.7
1.13
24.0
1.5
29.8
44.3
1.10
27.0
1.5
Return on Assets %
Return on Equity %
Asset Turnover
Net Margin %
Financial Leverage
2002
2003
2004
2005
2006
2007
2008
2009
2010
2011
06-12
Financial Health (USD)
316
4095
0.08
3730
—
4223
—
3530
—
5076
—
4375
—
7466
—
6816
—
9984
—
8038
—
14532
—
12657
—
22297
—
18645
—
31640
—
20049
—
47791
—
20956
—
—
76615 111746
—
—
17018 18883
Long-Term Debt $Mil
Total Equity $Mil
Debt/Equity
Working Capital $Mil
2002
2003
2004
2005
2006
2007
2008
2009
2010
2011
TTM
Valuation
227.3
0.1
0.9
1.3
33.0
57.5
0.0
1.2
1.8
19.7
50.5
0.0
2.6
4.5
17.2
38.8
—
3.8
7.2
30.1
30.8
—
3.6
6.5
19.8
43.5
0.0
6.7
10.3
27.5
15.8
0.0
2.3
3.3
7.2
20.5
0.0
4.1
5.3
16.0
18.0
0.0
3.9
5.4
13.2
11.5
—
3.0
4.2
8.4
15.7
1.1
4.2
5.6
12.1
Price/Earnings
P/E vs. Market
Price/Sales
Price/Book
Price/Cash Flow
Quarterly Results (USD)
Revenue $Mil
Most Recent
Previous
Sep
Close Competitors
Dec
Mar
Jun
28270.0 46333.0 39186.0 35023.0
20343.0 26741.0 24667.0 28571.0
Rev Growth %
Sep
Dec
Mar
Jun
Most Recent
Previous
39.0
66.7
73.3
70.5
58.9
82.7
22.6
82.0
Earnings Per Share $
Most Recent
Previous
Sep
Dec
Mar
Jun
7.05
4.64
13.87
6.43
12.30
6.40
9.32
7.79
Mkt Cap $Mil
Rev $Mil
P/E
ROE%
249490
246747
73723
43162
14.9
22.3
27.5
19.0
Microsoft Corporation
Google, Inc. Class A
Major Fund Holders
% of shares
Fidelity Contrafund
Vanguard Total Stock Mkt Idx Inv
Vanguard Total Stock Mkt Idx
©2012 Morningstar. All Rights Reserved. The information, data, analyses and opinions contained herein (1) include the confidential and proprietary information of Morningstar, (2) may include, or be derived from, account
information provided by your financial advisor which cannot be verified by Morningstar, (3) may not be copied or redistributed, (4) do not constitute investment advice offered by Morningstar, (5) are provided solely for
informational purposes and therefore are not an offer to buy or sell a security, and (6) are not warranted to be correct, complete or accurate. Except as otherwise required by law, Morningstar shall not be responsible for any
trading decisions, damages or other losses resulting from, or related to, this information, data, analyses or opinions or their use. This report is supplemental sales literature. If applicable it must be preceded or accompanied
by a prospectus, or equivalent, and disclosure statement.
1.33
1.26
1.22
®
ß
Release date 09-30-2012
Page 2 of 4
Stock Detail Report
Disclosure Statement
Style
The Morningstar Style consists of nine categories that provide an overview of
the investment strategy. The style is comprised of a combination of market
capitalization of the security and the investment style (value, blend, or growth).
Please read this information carefully. In all cases, this disclosure statement
should accompany the Stock Detail report. Morningstar is not itself a FINRAmember firm. All data presented is based on the most recent information
available to Morningstar. Morningstar gathers data from many sources including
third party providers such as Comstock and Reuters. Unless otherwise stated,
all data and statistics presented in the report are as of the release date noted
within the Detail Report and constitute "as originally reported" information.
Stock Grades
The grading system is a letter-based system from A through F, with A being the
highest. The Growth Grade shows how well the company's growth compares
with the Morningstar universe. Growth is measured by revenue per share. The
Profitability Grade shows how well a company's profitability, as measured by
return on equity, compares with the Morningstar universe. The Financial Health
Grade compares a company's enterprise value with the book value of its
liabilities, rewarding those firms that have a low probability of enterprise value
falling below the value of liabilities.
Last Close $
The stock price shown represents the market price of the stock as of the close of
trading on the release date noted at the top of the investment detail page.
Market Capitalization $ mil
The value of a company as determined by the market price of its outstanding
common stock. It is calculated by multiplying the market price as of the close of
trading as of the last day of the most recent month-end by the number of shares
outstanding as of the most recently completed fiscal quarter. It may be used as
an indicator of how investors value a company's future prospects.
Morningstar Rating
The Morningstar Rating for stocks is calculated by comparing Morningstar's
assessment of a stock's fair value with the stock's current market price. The
rating is assigned a five star rating if fair value is 30% or more above the
current market price, four star rating if it is 10% to 30% above the current
market price, three star rating if fair value is 10% above or below the current
market price, two star rating if fair value is 10% to 30% below the current
market price, and a one star rating for a fair value of 30% or more below the
current market price.
Fair Value Uncertainty
Fair Value Uncertainty is meant to give investors an idea of how tightly we feel
we can bound our fair value estimate for any given company. To generate
Morningstar Fair Value Uncertainty, analysts consider the following factors:
Sales predictability, Operating leverage, Financial leverage, a firm's exposure to
contingent events. Based on these factors, analysts classify the stock into one
of several uncertainty levels: Low, Medium, High, Very High, or Extreme. The
greater the level of uncertainty, the greater the discount to fair value required
before a stock can earn 5 stars, and the greater the premium to fair value before
a stock earns a 1-star rating.
Fair Value
Each stock's fair value is estimated by utilizing a proprietary discounted cash
flow model (DCF). This model assumes that the stock's value is equal to the
total of the free cash flows of the company is expected to generate in the
future, discounted back to the present at the rate commensurate with the
riskiness of the cash flows. As with any DCF model, the ending value is highly
sensitive to Morningstar's projections of future growth.
Economic Moat
Economic Moat measures the strength and sustainability of a firm's competitive advantage. Many factors are considered when assigning this rating,
including the firm's historical performance, the source of the company's excess
economic profits, market share, ability to produce products at lower costs than
competitors, governmental protection via patents/copyrights, high customer
switching costs, and other various considerations as determined by our Editorial
staff. The rating value assigned will be either none, narrow, or wide.
Stock Performance
Total Return represents shareholders' gains from a stock over a given period of
time (YTD, one month, three month, one-, three-, and five year). Total return
includes both capital gains and losses and dividend payments. It is calculated
by taking the change in the stock's price as of the close of trading of the
respective period, assuming dividends are not reinvested, then dividing by the
initial stock price, and expressing the result as a percentage. Returns for
periods longer than one year are annualized. Returns do not include brokerage
commission or the effects of taxation.
Financials
Earnings per share $ (EPS), diluted EPS, is calculated by dividing net income
net of preferred dividends by a weighted average of total shares outstanding
plus additional common shares that would have been outstanding if the dilutive
common share would have been issued for the trailing 12 months (TTM).
Dividend per share $ is the dollar amount of dividends paid out by the company
in a particular period to its common shareholders, as reported by the company.
Profitability
Return on Assets (ROA) is the percentage a company earns on its assets in a
given year (year 1, 2, etc.). The calculation is net income divided by end-of-year
total assets, then multiplied by 100.
Return on Equity (ROE) is the percentage a company earns on its total equity in a
given year (Year 1, 2, etc.). The calculation is net income divided by end-of-year
net worth, multiplied by 100.
Net Margin is a measure of profitability. It is equal to annual net income divided
by revenues from the same period for the past five fiscal years, multiplied by
100.
Asset Turnover represents how many dollars in revenue a company has
generated per each dollar of assets. It is calculated by dividing total revenues
for the period by total assets for the same period.
Financial leverage is calculated by dividing total assets by total shareholders'
equity.
Valuation
Price/Earnings (PE) is the current price divided by the company's trailing 12month earnings per share.
Price/Book (PB) is the most recent stock price divided by the most recent book
value per share.
Price/Sales (PS) is the current price divided by the company's sales per share
©2012 Morningstar. All Rights Reserved. The information, data, analyses and opinions contained herein (1) include the confidential and proprietary information of Morningstar, (2) may include, or be derived from, account
information provided by your financial advisor which cannot be verified by Morningstar, (3) may not be copied or redistributed, (4) do not constitute investment advice offered by Morningstar, (5) are provided solely for
informational purposes and therefore are not an offer to buy or sell a security, and (6) are not warranted to be correct, complete or accurate. Except as otherwise required by law, Morningstar shall not be responsible for any
trading decisions, damages or other losses resulting from, or related to, this information, data, analyses or opinions or their use. This report is supplemental sales literature. If applicable it must be preceded or accompanied
by a prospectus, or equivalent, and disclosure statement.
®
ß
Release date 09-30-2012
Page 3 of 4
over the trailing 12 months.
Price/Sales is the stock's price divided by the company's sales per share.
Price/Cash Flow (PC) is the most recent price divided by the cash flow per share
of the latest fiscal year.
PEG Ratio is Forward P/E ratio divided by the company's EPS Growth % FiveYear Mean Estimate. The Forward P/E ratio used in the numerator of this ratio
is calculated by taking the current share price and dividing by the mean EPS
estimate for the current fiscal year. The denominator is the average estimate
of long-term EPS growth, derived from all polled analysts' estimates from
Reuters Estimates.
Growth Rates
All the figures in the Growth section represent the compounded or annualized
growth rate. These figures are collected for revenue, net income, EPS, equity per
share, and dividends.
Profitability Analysis
The below referenced items are reported as both a current value and a 5-year
average figure.
Return on Equity % is the percentage a company earns on its total equity in a
given year. The calculation is net income divided by end-of-year net worth.
Return on Assets % is the percentage a company earns on its assets in a given
year. The calculation is net income divided by end-of-year total assets.
Revenue/Employee $K looks at a company's sales in relation to the number of
employees it has. This ratio is most useful when compared against other
companies in the same industry. Ideally, a company wants the highest revenue
per employee possible, as it denotes higher productivity.
Operating Margin % is used to measure pricing strategy and operating
efficiency. It is calculated by dividing operating income by net sales. Also
known as operating profit margin or net profit margin.
Net Margin % is equal to annual net income divided by revenues.
Free Cash Flow/Rev % is free cash flow divided by sales for the same time
period. Free cash flow is calculated by subtracting capital spending from cash
flow from operations for the same time period. It is the money left over after
investment, and it can be used to pay dividends, buy back stock, or pay down
debt.
Valuation Analysis
The below referenced items are reported as both a current value and a 5-year
average figure.
Price/Earnings is the stock's price divided by the company's earnings per share.
Forward P/E ratio is the most-recent stock price divided by the mean EPS
estimate for the current fiscal year. This number gives some indication of how
cheap or expensive a stock is compared with consensus earnings estimates.
The lower the forward P/E, the cheaper the stock. Reuters Estimates data is
used in the denominator of this calculation.
Price/Cash Flow is the stock's price divided by the cash-flow per share of the
latest fiscal year.
Price/Free Cash Flow is the free cash flow divided by its "enterprise value", or
market capitalization plus net debt. This number tells you what cash return you
would get if you bought the entire company, including its debt.
Dividend Yield % is a percentage calculated by dividing total dividends by the
current market price and multiplying by 100.
Price/Book is the stock price divided by the book value per share.
Market
Standard & Poor's 500: A market capitalization-weighted index of 500 widely
held stocks often used as a proxy for the stock market.
Investment Risks
International/Emerging Market Equities: Investing in international securities
involve special additional risks. These risks include, but are not limited to,
currency risk, political risk, and risk associated with varying accounting
standards. Investing in emerging markets may accentuate these risks.
Sector Strategies: Portfolios that invest exclusively in one sector or industry
involve additional risks. The lack of industry diversification subjects the investor
to increased industry-specific risks.
Non-Diversified Strategies: Portfolios that invest a significant percentage of
assets in a single issuer involve additional risks, including share price
fluctuations, because of the increased concentration of investments.
Small Cap Equities: Portfolios that invest in stocks of small companies involve
additional risks. Smaller companies typically have a higher risk of failure, and
are not as well established as larger blue-chip companies. Historically, smallercompany stocks have experienced a greater degree of market volatility that the
overall market average.
Mid Cap Equities: Portfolios that invest in companies with market capitalization
below $10 billion involve additional risks. The securities of these companies
may be more volatile and less liquid than the securities of larger companies.
High-Yield Bonds: Portfolios that invest in lower-rated debt securities
(commonly referred as junk bonds) involve additional risks because of the lower
credit quality of the securities in the portfolio. The investor should be aware of
the possible higher level of volatility, and increased risk of default.
Tax-Free Municipal Bonds: The investor should note that the income from taxfree municipal bond funds may be subject to state and local taxation and the
Alternative Minimum Tax.
Bonds: Bonds are subject to interest rate risk. As the prevailing level of bond
interest rates rise, the value of bonds already held in a portfolio decline.
Portfolios that hold bonds are subject to declines and increases in value due to
general changes in interest rates.
HOLDRs: The investor should note that these are narrow industry-focused
products that, if the industry is hit by hard times, will lack diversification and
possible loss of investment would be likely. These securities can trade at a
discount to market price, ownership is of a fractional share interest, the
underlying investments may not be representative of the particular industry, the
HOLDR might be delisted from the AMEX if the number of underlying companies
drops below nine, and the investor may experience trading halts.
©2012 Morningstar. All Rights Reserved. The information, data, analyses and opinions contained herein (1) include the confidential and proprietary information of Morningstar, (2) may include, or be derived from, account
information provided by your financial advisor which cannot be verified by Morningstar, (3) may not be copied or redistributed, (4) do not constitute investment advice offered by Morningstar, (5) are provided solely for
informational purposes and therefore are not an offer to buy or sell a security, and (6) are not warranted to be correct, complete or accurate. Except as otherwise required by law, Morningstar shall not be responsible for any
trading decisions, damages or other losses resulting from, or related to, this information, data, analyses or opinions or their use. This report is supplemental sales literature. If applicable it must be preceded or accompanied
by a prospectus, or equivalent, and disclosure statement.
®
ß
Release date 09-30-2012
Hedge Funds: The investor should note that hedge fund investing involves
specialized risks that are dependent upon the type of strategies undertaken by
the manager. This can include distressed or event-driven strategies, long/short
strategies, using arbitrage (exploiting price inefficiencies), international
investing, and use of leverage, options and/or derivatives. Although the goal of
hedge fund managers may be to reduce volatility and produce positive absolute
return under a variety of market conditions, hedge funds may involve a high
degree of risk and are suitable only for investors of substantial financial means
who could bear the entire loss of their investment.
Bank Loan/Senior Debt: Bank loans and senior loans are impacted by the risks
associated with fixed income in general, including interest rate risk and default
risk. They are often non-investment grade; therefore, the risk of default is high.
These securities are also relatively illiquid. Managed products that invest in
bank loans/senior debt are often highly leveraged, producing a high risk of
return volatility.
Exchange Traded Notes (ETNs): ETNs are unsecured debt obligations. Any
repayment of notes are subject to the issuer's ability to repay its obligations.
ETNs do not typically pay interest.
Leveraged ETFs: Levered investments are designed to meet multiples of the
return performance of the index they track and seek to meet their fund
objectives on a daily basis (or other time period stated within the Fund
objective). The leverage/gearing ratio is the amount of excess return that a
levered investment is designed to achieve in comparison to its index
performance (i.e. 200%, 300%, -200%, or -300% or 2X, 3X. -2X, -3X).
Compounding has the ability to affect the performance of the fund to be either
greater or less than the index performance multiplied by the multiple stated
within the funds objective over a stated time period.
Page 4 of 4
High double- and triple-digit returns were the result of extremely favorable
market conditions, which may not continue to be the case. High returns for short
time periods must not be a major factor when making investment decisions.
Benchmark Disclosure
Barclays US Agg Bond TR USD
This index is composed of the BarCap Government/Credit Index, the MortgageBacked Securities Index, and the Asset-Backed Securities Index. The returns we
publish for the index are total returns, which include reinvestment of dividends.
MSCI EAFE NR USD
This Europe, Australasia, and Far East index is a market-capitalization-weighted
index of 21 non-U.S., industrialized country indexes.
S&P 500 TR
A market capitalization-weighted index of 500 widely held stocks often used as
a proxy for the stock market. TR (Total Return) indexes include daily
reinvestment of dividends.
USTREAS T-Bill Auction Ave 3 Mon
Three-month T-bills are government-backed short-term investments considered
to be risk-free and as good as cash because the maturity is only three months.
Morningstar collects yields on the T-bill on a weekly basis from the Wall Street
Journal.
Short Positions: When a short position moves in an unfavorable way, the losses
are theoretically unlimited. The broker may demand more collateral and a
manager might have to close out a short position at an inopportune time to limit
further losses.
Long-Short: Due to the strategies used by long-short funds, which may include
but are not limited to leverage, short selling, short-term trading, and investing in
derivatives, these funds may have greater risk, volatility, and expenses than
those focusing on traditional investment strategies.
Liquidity Risk: Closed-end fund, ETF, and HOLDR trading may be halted due to
market conditions, impacting an investor’s ability to sell a fund.
Market Price Risk: The market price of ETFs, HOLDRs, and closed-end funds
traded on the secondary market is subject to the forces of supply and demand
and thus independent of the NAV. This can result in the market price trading at
a premium or discount to the NAV which will affect an investor’s value.
Market Risk: The market prices of ETF’s and HOLDRs can fluctuate as a result of
several factors, such as security-specific factors or general investor sentiment.
Therefore, investors should be aware of the prospect of market fluctuations and
the impact it may have on the market price.
Target-Date Funds: Target-date funds typically invest in other mutual funds and
are designed for investors who are planning to retire during the target date year.
The fund's target date is the approximate date of when investors expect to
begin withdrawing their money. Target-date fund's investment
objective/strategy typically becomes more conservative over time primarily by
reducing its allocation to equity mutual funds and increasing its allocations in
fixed-income mutual funds. An investor's principal value in a target-date fund is
not guaranteed at anytime, including at the fund's target date.
©2012 Morningstar. All Rights Reserved. The information, data, analyses and opinions contained herein (1) include the confidential and proprietary information of Morningstar, (2) may include, or be derived from, account
information provided by your financial advisor which cannot be verified by Morningstar, (3) may not be copied or redistributed, (4) do not constitute investment advice offered by Morningstar, (5) are provided solely for
informational purposes and therefore are not an offer to buy or sell a security, and (6) are not warranted to be correct, complete or accurate. Except as otherwise required by law, Morningstar shall not be responsible for any
trading decisions, damages or other losses resulting from, or related to, this information, data, analyses or opinions or their use. This report is supplemental sales literature. If applicable it must be preceded or accompanied
by a prospectus, or equivalent, and disclosure statement.
®
ß

