MAT 118 Exam Review: Statistics Problems & Solutions
advertisement
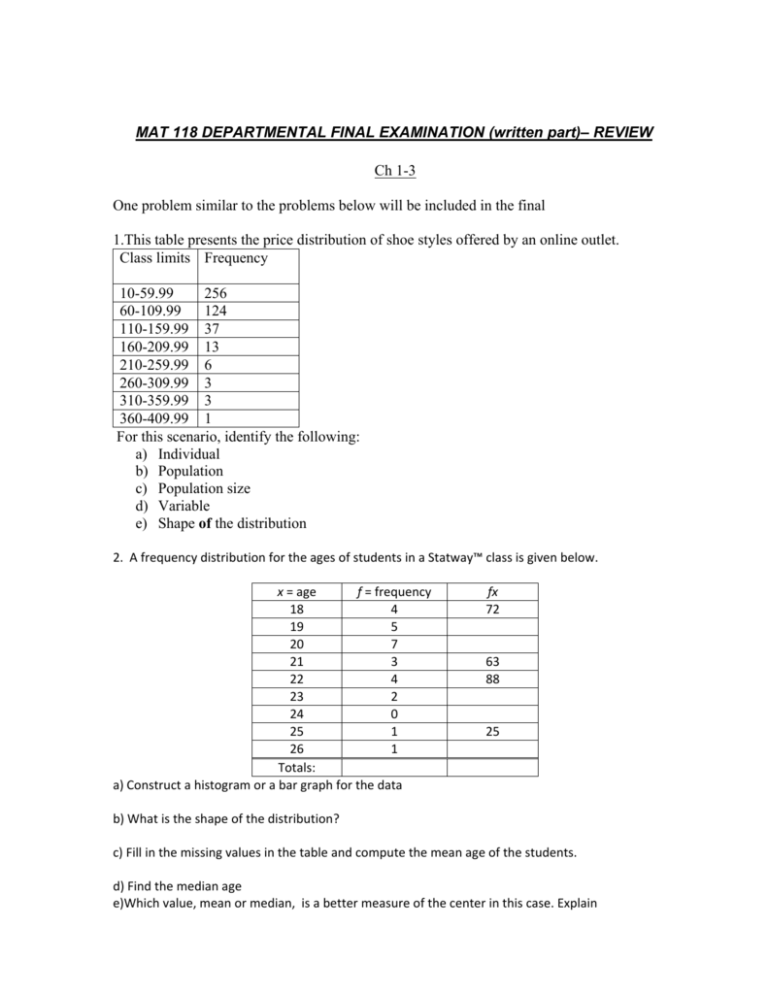
MAT 118 DEPARTMENTAL FINAL EXAMINATION (written part)– REVIEW Ch 1-3 One problem similar to the problems below will be included in the final 1.This table presents the price distribution of shoe styles offered by an online outlet. Class limits Frequency 10-59.99 256 60-109.99 124 110-159.99 37 160-209.99 13 210-259.99 6 260-309.99 3 310-359.99 3 360-409.99 1 For this scenario, identify the following: a) Individual b) Population c) Population size d) Variable e) Shape of the distribution 2. A frequency distribution for the ages of students in a Statway™ class is given below. x = age f = frequency fx 18 4 72 19 5 20 7 21 3 63 22 4 88 23 2 24 0 25 1 25 26 1 Totals: a) Construct a histogram or a bar graph for the data b) What is the shape of the distribution? c) Fill in the missing values in the table and compute the mean age of the students. d) Find the median age e)Which value, mean or median, is a better measure of the center in this case. Explain 3. The following frequency table shows the test score distribution for a random sample of 25 students in an introductory statistics class. Score Relative Frequency 30 – 40 0.08 41 – 51 0.04 52 – 62 63 – 73 0.24 74 – 84 0.20 85 – 95 0.32 a. Find the missing relative frequency. b. How many students in the sample had a score of at least 63? c. If there are 800 students total in all of the introductory statistics classes, estimate how many students scored between 52 and 84 in the test. d. Determine the midpoints of the classes and use them to compute the average test score for the sample. 4. The stem and leaf plot below lists the ages (in years) at the time of the award of the Nobel Prize winners in Economics from 2001 to present. (www.nobelprize.org). stem leaf 5 12677889 6 1114489 7 355666 84 90 a. Construct a relative frequency table for these data. Use classes of width 7 and take 51 for the lower limit of the first class. b. Obtain the five-number summary (i.e. Minimum, Q1, Q2, Q3, and Maximum) for the data. c. Construct a box-plot using the statistics computed in part b. Ch 4 One problem similar to the problems below will be included in the final 5. A friend says that she only pays attention to sugar amounts in a cereal. But, when she talks about what she eats, she also is concerned by fat. She believes that low levels of sugar in a food indicate that the food also has low amounts of fat. She also believes that when a food has high levels of sugar it also has high amounts of fat. The scatterplot below shows the sugar and fat content of cereals. Think about your friend’s beliefs about patterns of fat and sugar in food. Does the pattern your friend describes appear to be true for the cereals in the scatterplot? Explain how the scatterplot supports your answer. fat (grams) 5 4 3 2 1 0 0 2 4 6 8 10 12 14 16 sugar (grams) 6 If a major league baseball player gets more hits, will the player also get more home runs? We want to examine the relationship between the number of hits and the number of home runs made by professional baseball players. The table below shows a random sample of 10 baseball players from the 2010‐2011 season. The table shows the players’ number of hits and the number of home runs Number of Hits Number of Home Runs 119 7 128 12 109 14 125 18 135 34 111 17 195 21 163 13 207 10 163 31 A Draw a scatterplot. B What does each dot in this scatterplot represent? C Based on the scatterplot, should you use the number of hits a player gets to predict the number of home runs the player will get? Explain how the scatterplot supports your answer. 7 Researchers gathered data about the amount of fat, sugar, and carbohydrates in 22 fast food hamburgers. They gathered the information from fast food companies’ websites. To keep their measurements consistent, all data was described in grams. Using the companies’ websites, the researchers also identified the number of calories for each hamburger. The researchers wanted to know if the amount of calories in the hamburgers depended on how much of each ingredient (fat, sugar and carbohydrates) was in the burger. That is, the researchers wanted to know whether there was a relationship between the amount of fat, sugar, and carbohydrates and the amount of calories in a hamburger. A line has been added to each graph to help you see the patterns more clearly. Calories vs. Carbohydrates 5.0 7.5 10.0 Sugar (grams) 12.5 15.0 Calories vs. Fat 1000 900 800 700 600 500 400 300 Calories Calories Calories Calories vs. Sugar 1000 900 800 700 600 500 400 300 20 30 40 50 60 1000 900 800 700 600 500 400 300 70 10 20 30 Carbohydrates (grams) 40 50 60 Fat (grams) A About how many calories would you predict for a burger that has 20 grams of fat? B About how many calories would you predict for a hamburger that has 40 grams of carbohydrates? C Which prediction is likely to be more accurate? Why do you think this? D Which nutrient has the weakest impact on calories? Why do you think this? E What does the idea of strength tell you about whether an nutrient is a good predictor of calories? F What is the direction of the fat/calories graph? What does the direction of the line tell you about the association between the amount of fat and the calories in fast food hamburgers? 8 Suppose that for a certain baseball season, winning percentage, y, and on‐base percentage, x, are linearly related by the least squares regression equation . For this baseball season, the lowest on‐base percentage was 0.310 and the highest was 0.362. a) What does the slope mean in the context of this problem? b) Would it be a good idea to use this model to predict the winning percentage of a team whose on‐base percentage is 0.156? Why or why not? c) Based on this model, what would you expect the winning percentage to be for a team with on‐base percentage 0.350? Ch 5-6 2 problems similar to the problems below will be included in the final 9. The question, "Do you read books for fun every day?" was asked of a random sample of 500 children ages 5-11. Results are shown in the table. . Boy Girl total a) In this sample, what proportion of children are boys? yes 48 76 b) What proportion of children read books for fun every day? c) What proportion of boys read books for fun every day? d) What proportion of girls read books for fun every day? no 182 total 194 70 e) Based on the findings, is the likelihood of reading books for fun affected by the gender of a child? Explain. 10. When children come to visit Santa at the mall, 75% say they have been good all year (based on Auntie Annie pretzel survey). 10 children come to sit on Santa’s lap. He asks them if they have been good or bad. a) Can this be considered a binomial experiment? Why or why not? b) What is the probability that all children say they were good? c) What is the probability that at least one child says he/she was bad? 11. A shipment of 200 computers contains 4 defective machines. Two computers are selected at random without replacement and tested for being defective. a) Is this a binomial experiment? Why or why not? b) What is the probability that both computers are defective? c) What is the probability that at least one is defective? 12. In a group of 40 people, 35% have never been abroad. Two people are selected at random without replacement and are asked about their past travel experience. a) Is this a binomial experiment? Why or why not? b) What is the probability that at least one has been abroad? 13. 60% of LaGuardia students are female. A random sample of 5 students is to be selected. Let the random variable X be the number of female students in the sample. a) Explain why X is a binomial random variable. b) Give the values of parameters n and p c) What is the probability that out of the 5 randomly selected students exactly 3 are female? d) What is the probability that out of 5 randomly selected students at most 2 are male? e) What is the expected number of female students in a random sample of 50? f) Would it be unusual if a random sample of 50 LaGCC students only 20 students were female? Explain your answer. 14. Suppose you pay $2 to play a game of chance, in which you toss a coin and roll a die. You are paid $10 if your coin shows a tail and you roll at least a five on the die. a. Over the long term, what is your expected profit per game? b. If you played this game 100 times, how much would you expect to win /loose? 15. A person is asked to toss a die once. If a die shows an odd number, a person wins that number of dollars. If a die shows an even number, a person loses that number of dollars. Construct a probability distribution table where the random variable is the amount won or lost. What is the expected value of this random variable? 16. A person selects a card from a standard deck. If the card is red, she must pay $1. If it is a black card between 2 and 10, she wins 50 cents. If is a black picture card, she wins $2. If it is a black ace she wins $5. What is the expected value of her gain or loss from the game, to the nearest tenth of a cent? 17. Polio is a very severe illness that can cause paralysis in its victims. Many people who had polio in the early part of the 1900s became paralyzed and were unable to move their legs or other limbs. The most famous polio victim was Franklin D. Roosevelt, who was the US President from 1933‐ 1945. In 1954, researchers did a randomized experiment on the effectiveness of a vaccine to prevent Polio. The real vaccine was given to 200,745 children and a fake vaccine was given to 201,229 children. The results showed that 33 of the children given the real vaccine developed polio, while 115 of the children given the fake vaccine developed polio. A Complete the two‐way table below that compares vaccine type and whether or not the children developed polio. Type of Vaccine Polio Real Fake Totals Developed Polio Did not Develop Polio Totals In sections b‐d, round your answer to 5 decimal places. B Find the probability that a child was vaccinated and developed polio? Use probability notation and give the answer as a decimal. C Calculate the conditional probability that a vaccinated child developed polio. Use probability notation and give the answer as a decimal. D Calculate the conditional probability that a child given the fake vaccine developed polio. Use probability notation and give the answer as a decimal. E Which children had a greater rate of developing polio? Ch 7-10 2 problems similar to the problems below will be included in the final . 18. Suppose that the test results for a certification exam are normally distributed with a mean of 87 and a standard deviation of 17. a. What is the z-score for a test result of 100? b. What value has a z-score of -1.5? c. Approximately what percentage of exam takers will pass if the passing grade is 75? 19. The real estate broker's examination in a certain state had a mean score of 435 and a standard deviation of 72. If the board wants to set the passing score so that only the best 35% of all applicants pass, what is the passing score? Assume that the scores are normally distributed. 20. A large survey found that an American family generates an average of 17.2 lb of glass garbage each year. Assume normal distribution with the standard deviation of 2.5 pounds. a) What proportion of families generates less than 16 lbs of glass garbage each year? b) If a family is selected at random, what is the probability that it generated less than 16 lbs of glass garbage in a year? c) If a sample of 55 families is randomly selected, what is the probability that the sample mean is below 16 lb? 21. The amounts of debt people have accumulated one year after having started to use their first credit card is normally distributed. Visa takes a sample of 36 people who opened the account one year ago and finds that for this group of people the average amount of debt accumulated was $700. The standard deviation is $180. a) Find the 90% confidence interval for the mean amount of debt Visa can expect credit card holders to accumulate one year after opening their first account b) If you increase the confidence level, will the confidence interval estimate be wider or narrower? Explain. 22. Suppose that we want to test the hypothesis with a significance level of α =.05 that the climate has changed since industrialization. The mean of average annual temperatures throughout recorded history is 50 degrees and the standard deviation is 2 degrees. During the last 40 years, the mean of average annual temperatures has been 51 degrees. What can we conclude? 23. US citizens spend an average of 2.5 hours per day talking and/or texting on cell phones with a standard deviation of 0.7 hours. A sample of 35 teens aged 15-18 years showed an average of 2.9 hours of cell phone use per day. Can we conclude that teens in this age group spend more time on cell phone then adults at α =.05 level of significance? 24. Suppose an editor of a publishing company claims that the mean time to write a textbook is at most 15 months. A sample of 16 textbook authors is randomly selected and it is found that the mean time taken by them to write a textbook was 12.5. Assume also that the standard deviation is known to be 3.6 months. Assuming the time to write a textbook is normally distributed and using a 0.025 level of significance, would you conclude the editor’s claim is true? 25. The number of hours worked per week by medical residents is normally distributed with a standard deviation of 4.8 hours. We want to test the claim that the mean number of hours worked per week by medical residents is more than 60 hours. Based on a sample of 36 medical residents, what is the largest value of the sample mean for which we would fail to reject the null hypothesis at a 5% significance level? Answer key 1. a) A shoe style b) All shoe styles offered the online outlet c) 443 d) The price e) Skewed right 2. a) Bar graph: c) Mean = 20.6 x = age 18 19 20 21 22 23 24 25 26 Totals: b) Skewed to the right f= frequency 4 5 7 3 4 2 0 1 1 27 fx 72 95 140 63 88 46 0 25 26 555 d) Median = 20 (14th entry) e) The median would be better because the distribution is skewed. 3. a) Missing value: 1 - 0.88 = 0.12 b) 25 x 0.76 = 19 Score 30 – 40 41 – 51 52 – 62 63 – 73 74 – 84 85 – 95 Relative Frequency 0.08 Midpoint 35 2.8 0.04 46 1.84 0.12 57 6.84 0.24 68 16.32 0.20 79 15.8 0.32 90 28.8 c) 800 x 0.56 = 448 d) Sample mean approximately 72.4 Sum = 72.4 4. a) Class Intervals 51 – 57 58 – 64 65 – 71 72 – 78 79 – 85 86 - 92 c) f= frequency 5 8 2 6 1 1 rf = Relative Frequency 0.22 0.35 0.09 0.26 0.04 0.04 b) Five-number summary Min=51; Q1=58; Q2 (median)=64; Q3=75; Max=90 5 The friend believes that there is a positive correlation between sugar and fat contents. From the scatterplot, it is not evident that there exists any correlation between the two variables. The two variables appear unrelated. 6. a) B Each point represents a number of hits and number of home runs for each individual player in the data set C No, you should not, because the scatterplot suggests that there is no association between the number of hits and the number of home runs 7. a) 400 grams b) 600 grams c) A prediction based on the amount of fat is likely to be more accurate, because points on the Calories vs. Fat scatterplot are less dispersed (follow the straight line more closely)than points on the Calories vs Carbohydrates scatterplot. d) Sugar has the weakest impact on calories. Points on Calories vs. Sugar scatterplot are more dispersed (follow the straight line less closely) than points on the other two scatterplots. This indicates the weakest linear association (correlation) between the two variables. e) The stronger is the association (positive or negative) between the nutrient and calories, the more accurate is the prediction of calories based on this nutrient. f) The direction of the fat/calories is positive. It indicates that there is a positive association between the amount of fat and the calories in fast food hamburgers. i.e as the amount of fat increases (decreases) the amount of calories also increases (decreases) 8. d) Every 1% increase in on-base percentage will lead to 2.94% increase in winning percentage. e) Not a good idea, because the x-value of 0.156 is well outside of the range of values the regression equation was based upon. f) )= 0.5415 9. a) 230/500=46% b) 124/500= 24.8% c) 48/230 = 21% d) 76/270= 28.1% e) Yes, the difference between proportions in c) and d) is significant. Based on the sample, girls are more likely than boys to read books for fun every day. f) Events “a child reads books for fun every day” and “a child is a boy” are not independent, because gender has an effect on the probability of reading books for fun every day. 10. a) Yes, this is a binomial experiment, because • there is fixed number of times the experiment is performed (n=10) • for each trial, there are only two mutually exclusive outcomes: success = a child says he/she has been good failure = a child says he/she has been bad • trials are independent, so the probability of success is the same for each trial (p =.75) b) (0.75)10= 0.056… or about 5.6% c) 1-0.056 =0.944… or about 94.4% 11. a) This is not a binomial experiment because the trials are not independent ( the probability that the second computer is defective depends on whether the first computer is defective) b) Let x=number of defectives, P(x=2) = (4/200)(3/199) = .0003 c) P(x>=1) = 1 – P(x=0)= 1- (196/200)(195/199)=1-0.9603=0.0397 Another way: P(x>=1) = P(x=1)+P(x=2) =.0394+.0003=0.0397 Because P(x=1) = (4/200)(196/199)+(196/200)(4/199)=.0394 12. a) This is not a binomial experiment because the trails are not independent (the probability that the second person has been abroad depends on whether the first one selected is a traveler) b) What is the probability that at least one has been abroad? 35% of 40 = 14. Therefore, 14 out of 40 people have never been abroad. Let x=the number of people in a random sample of 2 who have been abroad Probability that at least one person has been abroad, P(x>=1) =1 – P(x=0)= 1-(14/40)(13/39)=.8833 13. g) X is a binomial random variable because x = number of successes out of 5 independent trials, where selection of female is considered a success and failure otherwise. The probability of success is 0.6 for every trial. h) Give the values of parameters n and p N = 5, p = 0.6 i) P(x=3) = 10*(.63)*(.42) = 0.3456 d) “at most 2 are male” (i.e. 0,1 or 2 males) is equivalent to “at least 4 are female”(i.e. 5,4 or 3 females) ---> P(X>= 3) = (.65) + (5*.41*.64) + (10*.42*.63) = 0.68256 e) What is the expected number of female students in a random sample of 50? 30 female students f) Yes it would be unusual. The usual number of female students would be between 23 and 37 (within 2 standard deviations of the mean where, mean is 30, and standard deviation = √(50 × .6 × .4) = 3.4641 14. a) Expected profit= -2 + 10*(1/2)*(2/6) = -$.3 i.e. expect to lose 33 cents per game. b) Lose $33.33 15. Let X be the amount won or lost. X ($) 1 3 5 -2 P(X) 1/6 1/6 1/6 1/6 -4 1/6 -6 1/6 E(X) = -1/2 or -$0.5 16. Event X ($) P(X) Red -1 26/52 Black 2 to 10 .5 18/52 picture ace 2 5 6/52 2/52 E(X) = 5/52 = .0962 of gain of 9.6 cents per game. 17.a) Type of Vaccine Polio Real Fake Totals Developed Polio 33 115 148 Did not Develop Polio 200712 201114 401826 Totals 200745 201229 401974 b) 0.00008 c) 0.00016 d)0.00057 e) The children given the fake vaccine had a greater rate of developing polio 18. a) 0.76 b) 61.5 c) about 76% 19. 463.08 20. a)P (x<16)= P(z<-.48) = .3156 = 31.6%. 31.6 % of families (or about 1 in 3 families) generate less than 16 lbs of glass garbage each year. b) The probability that a randomly selected family generated less than 16 lbs of glass garbage in a year is P (x<16)=P(z<-.48) = .3156 c) P (ẍ<16) = (z<-3.56) = almost 0 21. a) (650.65, 749.35) b) The interval will be wider, because the margin of error (E) will be larger. 22. t 0= 3.16 > t critical =(t 0.025,39)=2.02. Reject Null hypothesis ( H0: μ=50 ) . Therefore, there is sufficient evidence to conclude that the climate has changed since industrialization. 23. t 0= 3.38 > t critical = (t 0.05,34)=1.69. Reject Null hypothesis (H0: μ=2.5). Therefore, there is sufficient evidence to conclude at α =.05 level of significance that teens aged 15-18 years spend more time on cell phone then adults. 24. To conclude that the editor’s claim is true, we must be able to reject the Null hypothesis (H0: μ=15)in favor of the claim (Ha: μ<15), using one-tailed t-test with α =.025 and 15 degrees of freedom T 0 = -2.78< T critical = - 2.132, so we reject the Null hypothesis. Therefore, there is sufficient evidence to conclude that the editor’s claim is true at α =.025 25. The decision to fail to reject the Null hypothesis (H0:μ=60) would be based on the test statistic to being smaller than t critical = (t 0.05,35)=1.69 Therefore, the largest value of the sample mean for which we would fail to reject the null is ẍ=μ+ t critical σ /√n =60+1.64(4.8)/ √36= 61.31
