Condensed income statement of the Bank Austria Group1)
advertisement
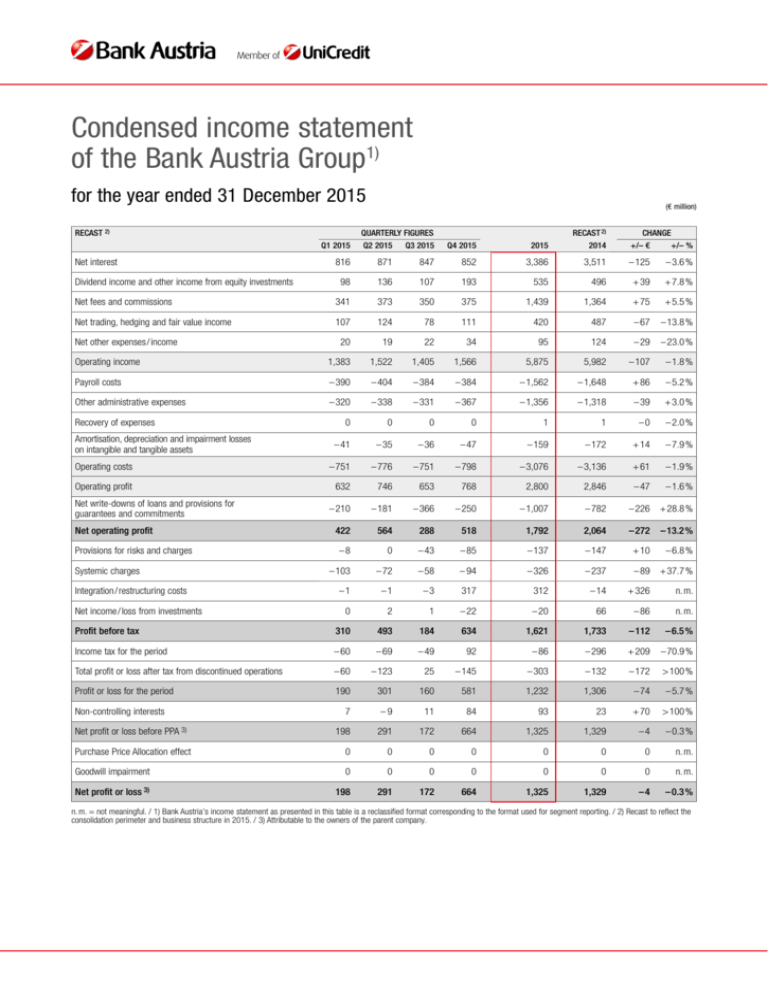
Condensed income statement of the Bank Austria Group1) for the year ended 31 December 2015 RECAST 2) (€ million) RECAST 2) QUARTERLY FIGURES CHANGE Q1 2015 Q2 2015 Q3 2015 Q4 2015 2015 2014 +/– € +/– % 816 871 847 852 3,386 3,511 – 125 –3.6% 98 136 107 193 535 496 + 39 +7.8% Net fees and commissions 341 373 350 375 1,439 1,364 + 75 +5.5% Net trading, hedging and fair value income 107 124 78 111 420 487 – 67 –13.8% 20 19 22 34 95 124 – 29 –23.0% Operating income 1,383 1,522 1,405 1,566 5,875 5,982 – 107 –1.8% Payroll costs – 390 – 404 – 384 – 384 – 1,562 – 1,648 + 86 –5.2% Other administrative expenses – 320 – 338 – 331 – 367 – 1,356 – 1,318 – 39 +3.0% 0 0 0 0 1 1 –0 –2.0% – 41 – 35 – 36 – 47 – 159 – 172 + 14 –7.9% Operating costs – 751 – 776 – 751 – 798 – 3,076 – 3,136 + 61 –1.9% Operating profit 632 746 653 768 2,800 2,846 – 47 –1.6% – 210 – 181 – 366 – 250 – 1,007 – 782 – 226 +28.8% 422 564 288 518 1,792 2,064 – 272 –13.2% –8 0 – 43 – 85 – 137 – 147 + 10 –6.8% – 103 – 72 – 58 – 94 – 326 – 237 – 89 +37.7% –1 –1 –3 317 312 – 14 + 326 n.m. 0 2 1 – 22 – 20 66 – 86 n.m. Profit before tax 310 493 184 634 1,621 1,733 – 112 –6.5% Income tax for the period – 60 – 69 – 49 92 – 86 – 296 + 209 –70.9% Total profit or loss after tax from discontinued operations – 60 – 123 25 – 145 – 303 – 132 – 172 >100% Profit or loss for the period 190 301 160 581 1,232 1,306 – 74 –5.7% 7 –9 11 84 93 23 + 70 >100% 198 291 172 664 1,325 1,329 –4 –0.3% Purchase Price Allocation effect 0 0 0 0 0 0 0 n.m. Goodwill impairment 0 0 0 0 0 0 0 n.m. loss 3) 198 291 172 664 1,325 1,329 –4 –0.3% Net interest Dividend income and other income from equity investments Net other expenses/income Recovery of expenses Amortisation, depreciation and impairment losses on intangible and tangible assets Net write-downs of loans and provisions for guarantees and commitments Net operating profit Provisions for risks and charges Systemic charges Integration/restructuring costs Net income/loss from investments Non-controlling interests Net profit or loss before PPA 3) Net profit or n. m. = not meaningful. / 1) Bank Austria’s income statement as presented in this table is a reclassified format corresponding to the format used for segment reporting. / 2) Recast to reflect the consolidation perimeter and business structure in 2015. / 3) Attributable to the owners of the parent company. Segment reporting of the Bank Austria Group 1–12 2015/1–12 2014 (€ million) RETAIL & CORPORATES Net interest 1 – 12 2015 1 – 12 2014 Dividends and other income 1 – 12 2015 from equity investments 1 – 12 2014 Net fees and commissions 1 – 12 2015 1 – 12 2014 Net trading, hedging and 1 – 12 2015 fair value income/loss 1 – 12 2014 Net other expenses/income 1 – 12 2015 1 – 12 2014 OPERATING INCOME 1 – 12 2015 1 – 12 2014 OPERATING COSTS 1 – 12 2015 1 – 12 2014 OPERATING PROFIT 1 – 12 2015 1 – 12 2014 Net write-downs of loans and provisions 1 – 12 2015 for guarantees and commitments 1 – 12 2014 NET OPERATING PROFIT 1 – 12 2015 1 – 12 2014 Provisions for risks and charges 1 – 12 2015 1 – 12 2014 Systemic charges 1 – 12 2015 1 – 12 2014 Integration/restructuring costs 1 – 12 2015 1 – 12 2014 Net income/loss from investments 1 – 12 2015 1 – 12 2014 PROFIT BEFORE TAX 1 – 12 2015 1 – 12 2014 Income tax for the period 1 – 12 2015 1 – 12 2014 Total profit or loss after tax from 1 – 12 2015 discontinued operations 1 – 12 2014 PROFIT OR LOSS FOR THE PERIOD 1 – 12 2015 1 – 12 2014 Non-controlling interests 1 – 12 2015 1 – 12 2014 NET PROFIT OR LOSS ATTRIBUTABLE 1 – 12 2015 TO THE OWNERS OF THE PARENT 1 – 12 2014 COMPANY BEFORE PPA Purchase Price Allocation effect 1 – 12 2015 1 – 12 2014 Goodwill impairment 1 – 12 2015 1 – 12 2014 NET PROFIT OR LOSS ATTRIBUTABLE 1 – 12 2015 TO THE OWNERS OF THE PARENT 1 – 12 2014 COMPANY CORPORATE & INVESTMENT PRIVATE BANKING BANKING (CIB) CENTRAL EASTERN EUROPE (CEE) CORPORATE CENTER BANK AUSTRIA GROUP (RECAST) BANK RECASTING AUSTRIA DIFFERGROUP ENCES 1) (PUBLISHED) 2) 895 974 29 40 506 479 34 24 23 31 1,486 1,548 – 1,096 – 1,108 390 440 – 28 – 56 363 383 –4 1 – 70 – 48 0 0 – 20 –9 269 327 – 73 – 69 0 0 196 259 – 12 –8 184 250 58 64 0 0 114 109 3 2 2 0 177 175 – 121 – 116 56 59 0 0 56 59 –1 –1 –5 –3 0 –1 0 0 51 53 – 13 – 13 0 0 38 40 0 0 38 40 294 302 0 0 104 84 48 52 5 1 451 440 – 215 – 208 235 232 25 3 260 236 –8 0 – 36 – 31 0 0 –8 2 208 208 – 52 – 52 1 0 157 156 0 0 157 156 2,381 2,456 364 345 718 702 329 266 24 55 3,816 3,824 – 1,475 – 1,501 2,341 2,323 – 1,017 – 675 1,324 1,648 – 68 – 137 – 155 – 120 –8 –7 2 13 1,094 1,396 – 169 – 212 – 423 – 206 502 977 102 25 604 1,003 – 242 – 285 142 111 –3 – 10 7 143 42 37 – 55 –3 – 168 – 204 – 223 – 207 12 – 55 – 210 – 262 – 56 –9 – 60 – 35 320 –5 6 60 –1 – 251 221 50 120 75 340 – 126 2 6 342 – 120 3,386 3,511 535 496 1,439 1,364 420 487 95 124 5,875 5,982 – 3,076 – 3,136 2,800 2,846 – 1,007 – 782 1,792 2,064 – 137 – 147 – 326 – 237 312 – 14 – 20 66 1,621 1,733 – 86 – 296 – 303 – 132 1,232 1,306 93 23 1,325 1,329 0 – 78 0 0 0 3 0 0 0 – 18 0 – 93 0 37 0 – 56 0 89 0 33 0 14 0 0 0 1 0 –2 0 45 0 9 0 0 0 54 0 1 0 54 3,386 3,433 535 496 1,439 1,367 420 487 95 106 5,875 5,890 –3,076 –3,099 2,800 2,790 –1,007 –693 1,792 2,097 –137 –133 –326 –237 312 –13 –20 64 1,621 1,778 –86 –287 –303 –132 1,232 1,360 93 23 1,325 1,383 0 0 0 0 184 250 0 0 0 0 38 40 0 0 0 0 157 156 0 0 0 0 604 1,003 0 0 0 0 342 – 120 0 0 0 0 1,325 1,329 0 0 0 0 0 54 0 0 0 0 1,325 1,383 1) The segment results have been recast. The difference compared to Bank Austria’s results is presented in a separate column showing “Recasting differences”, which for 2014 mainly relate to the transfer of Leasing subsidiaries in Russia, the Czech Republic, Slovakia, Romania, Croatia, Austria, Hungary and some Leasing entities in Serbia and Slovenia to Bank Austria. Recasting differences also relate to the sale of UniCredit CAIB Poland S. A. 2) The comparative figures for 2014 and 2015 reflect the accounting figures. Segment reporting of the Bank Austria Group 1–12 2015/1–12 2014 RETAIL & CORPORATES Risk-weighted assets (RWA) (avg.) 3) Loans to customers (end of period) Direct funding (end of period) 4) Cost/income ratio excl. bank levy in % Risk/earnings ratio in % 5) 1 – 12 2015 1 – 12 2014 1 – 12 2015 1 – 12 2014 1 – 12 2015 1 – 12 2014 1 – 12 2015 1 – 12 2014 1 – 12 2015 1 – 12 2014 19,671 19,696 44,856 43,208 42,889 42,767 73.7 71.6 3.0 5.5 CORPORATE & INVESTMENT PRIVATE BANKING BANKING (CIB) 524 600 618 588 9,079 8,990 68.5 66.3 n. m. n. m. 8,766 8,394 13,691 12,502 10,426 8,758 47.8 47.2 n. m. n. m. CENTRAL EASTERN EUROPE (CEE) CORPORATE CENTER BANK AUSTRIA GROUP (RECAST) 96,823 85,579 57,102 56,786 58,709 52,243 38.7 39.3 37.1 24.1 7,462 9,339 109 664 18,045 19,512 n. m. n. m. n. m. n. m. 133,246 123,609 116,377 113,749 139,148 132,269 52.3 52.4 25.7 19.5 BANK RECASTING AUSTRIA DIFFERGROUP ENCES 1) (PUBLISHED) 2) 0 1,473 0 – 17 0 15 n. m. n. m. n. m. n. m. 133,246 125,081 116,377 113,732 139,148 132,285 52.3 52.6 25.7 17.6 1) The segment results have been recast. The difference compared to Bank Austria’s results is presented in a separate column showing “Recasting differences”, which for 2014 mainly relate to the transfer of Leasing subsidiaries in Russia, the Czech Republic, Slovakia, Romania, Croatia, Austria, Hungary and some Leasing entities in Serbia and Slovenia to Bank Austria. Recasting differences also relate to the sale of UniCredit CAIB Poland S. A. 2) The comparative figures for 2014 and 2015 reflect the accounting figures. 3) Turkey consolidated on a proportionate basis. 4) Direct funding: deposits from customers and debt securities in issue. 5) Risk / earnings ratio: net write-downs of loans and provisions for guarantees and commitments measured against net interest and dividends and other income from equity investments. n. m. = not meaningful Statement of Financial Position of the Bank Austria Group at 31 December 2015 Assets Cash and cash balances Financial assets held for trading Financial assets at fair value through profit or loss Available-for-sale financial assets Held-to-maturity investments Loans and receivables with banks Loans and receivables with customers Hedging derivatives Changes in fair value of portfolio hedged items (+/ –) Investments in associates and joint ventures Property, plant and equipment of which held for investment Intangible assets Tax assets a) current tax assets b) deferred tax assets Non-current assets and disposal groups classified as held for sale Other assets TOTAL ASSETS (€ million) 31 DEC. 2015 31 DEC. 2014 2,146 3,013 89 24,810 484 32,214 116,377 3,290 41 4,741 2,132 827 221 448 94 353 2,467 1,167 193,638 1,942 3,533 110 22,148 572 30,542 113,732 3,952 – 99 4,644 2,147 896 171 570 72 499 3,600 1,554 189,118 Liabilities and equity Deposits from banks Deposits from customers Debt securities in issue Financial liabilities held for trading Financial liabilities at fair value through profit or loss Hedging derivatives Changes in fair value of portfolio hedged items (+/ –) Tax liabilities a) current tax liabilities b) deferred tax liabilities Liabilities included in disposal groups classified as held for sale Other liabilities Provisions for risks and charges a) post-retirement benefit obligations b) other provisions Equity of which non-controlling interests (+/–) TOTAL LIABILITIES AND EQUITY (€ million) 31 DEC. 2015 31 DEC. 2014 23,432 110,346 28,802 2,642 547 2,782 – 101 214 46 169 1,977 2,773 4,830 3,697 1,133 15,394 238 193,638 23,696 102,271 30,014 3,454 670 3,302 84 165 58 107 1,845 2,617 6,076 5,665 411 14,925 193 189,118

