delivering information- enabled energy: the new utility mandate
advertisement

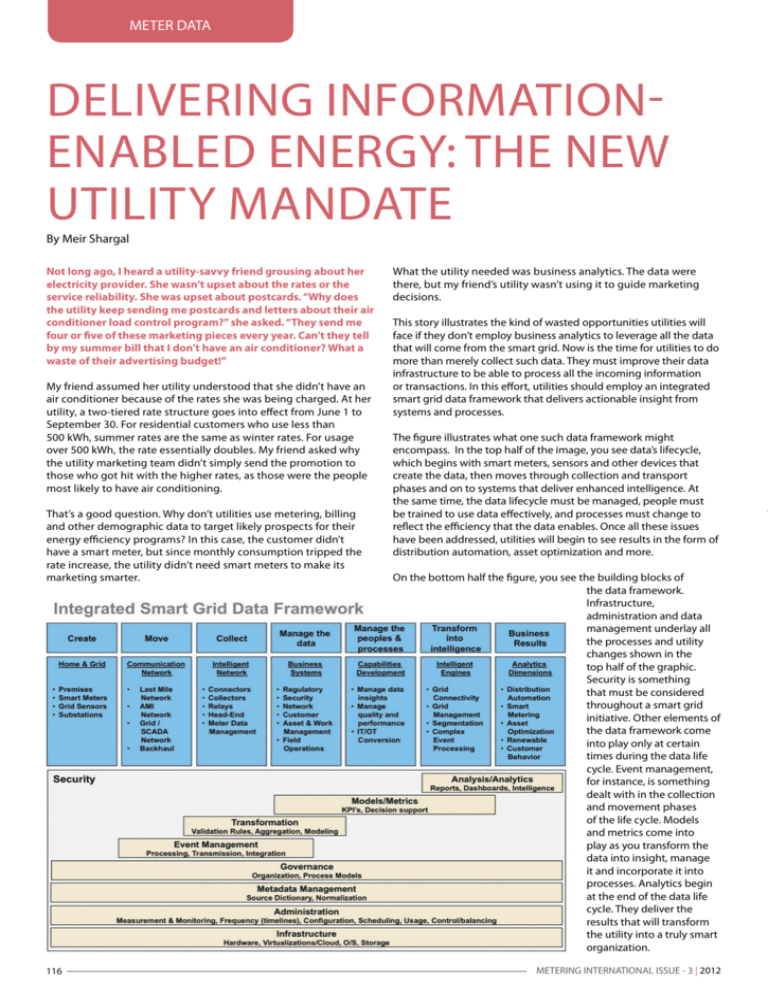
METER DATA DELIVERING INFORMATIONENABLED ENERGY: THE NEW UTILITY MANDATE By Meir Shargal Not long ago, I heard a utility-savvy friend grousing about her electricity provider. She wasn’t upset about the rates or the service reliability. She was upset about postcards. “Why does the utility keep sending me postcards and letters about their air conditioner load control program?” she asked. “They send me four or five of these marketing pieces every year. Can’t they tell by my summer bill that I don’t have an air conditioner? What a waste of their advertising budget!” My friend assumed her utility understood that she didn’t have an air conditioner because of the rates she was being charged. At her utility, a two-tiered rate structure goes into effect from June 1 to September 30. For residential customers who use less than 500 kWh, summer rates are the same as winter rates. For usage over 500 kWh, the rate essentially doubles. My friend asked why the utility marketing team didn’t simply send the promotion to those who got hit with the higher rates, as those were the people most likely to have air conditioning. That’s a good question. Why don’t utilities use metering, billing and other demographic data to target likely prospects for their energy efficiency programs? In this case, the customer didn’t have a smart meter, but since monthly consumption tripped the rate increase, the utility didn’t need smart meters to make its marketing smarter. 116 What the utility needed was business analytics. The data were there, but my friend’s utility wasn’t using it to guide marketing decisions. This story illustrates the kind of wasted opportunities utilities will face if they don’t employ business analytics to leverage all the data that will come from the smart grid. Now is the time for utilities to do more than merely collect such data. They must improve their data infrastructure to be able to process all the incoming information or transactions. In this effort, utilities should employ an integrated smart grid data framework that delivers actionable insight from systems and processes. The figure illustrates what one such data framework might encompass. In the top half of the image, you see data’s lifecycle, which begins with smart meters, sensors and other devices that create the data, then moves through collection and transport phases and on to systems that deliver enhanced intelligence. At the same time, the data lifecycle must be managed, people must be trained to use data effectively, and processes must change to reflect the efficiency that the data enables. Once all these issues have been addressed, utilities will begin to see results in the form of distribution automation, asset optimization and more. On the bottom half the figure, you see the building blocks of the data framework. Infrastructure, administration and data management underlay all the processes and utility changes shown in the top half of the graphic. Security is something that must be considered throughout a smart grid initiative. Other elements of the data framework come into play only at certain times during the data life cycle. Event management, for instance, is something dealt with in the collection and movement phases of the life cycle. Models and metrics come into play as you transform the data into insight, manage it and incorporate it into processes. Analytics begin at the end of the data life cycle. They deliver the results that will transform the utility into a truly smart organization. METERING INTERNATIONAL ISSUE - 3 | 2012 METER DATA Doing this takes more than hardware and software. It will take a shift in mindset, as well. In the end, information-based decision making must become a core part of a utility’s corporate culture and DNA. CONVERGING FORCES Now, more than ever, utilities need to run efficiently. It’s well known that some 30% of utility workers in North America, Europe and other locations are likely to retire in the next five years, leaving utilities with a potential shortage of skilled staff. Likewise, carbon concerns are bringing new regulatory mandates, such as various renewable generation requirements in the US and the 20/20/20 energy policy adopted by the European Union. It calls for a 20% reduction in greenhouse gas emissions, a 20% reduction in energy use, and 20% of generation to come from renewable energy by the year 2020. Then, too, there’s the pressure to maintain reliability. In an independent study sponsored by the Electric Power Research Institute (EPRI), it was estimated that power outages and related power disturbance are costing the US economy billions of dollars annually. The study, which was released in July 2011, examined roughly 2 million businesses and concluded that $45.7 billion is lost annually to outages, while another $6.7 billion is lost to power quality disturbances. Yet, aging infrastructure in the US is proving to be increasingly vulnerable to failure. Massoud Amin, a professor of electrical and computer engineering at the University of Minnesota, found that the number of non-disaster-related outages affecting at least 50,000 consumers grew 124% when you compare numbers from 1991 to 1995 against the numbers from 2001 and 2005. Specifically, there were 41 such blackouts in the earlier period and 92 in the latter. In 2006 alone, utilities reported 36 outages of this magnitude. AN OUNCE OF PREVENTION Use of analytics is one way utilities can meet all of the challenges noted above more effectively. On the grid side of the utility business, smart grid sensors and communications technologies promise to make predictive maintenance not only possible, but probable. Traditionally, utilities might have had periodic inspection processes in place to check for gross level weaknesses but, in general, they ran distribution assets until failure occurred. Now, utilities are putting sensors in to measure and capture a variety of metrics, then using the insights gained to implement proactive maintenance. Among factors measured are loading and its suitability for an asset’s load ratings, oil temperatures and exhaust gasses, asset acoustics – or the noises the asset makes – and vibrations. For switches, utilities are monitoring cycles, because the more times you use a switch, the more opportunities this mechanical device has to fail. Some utilities are starting to look at the types of trees around distribution lines to better predict storm-related failures. Pine trees are more likely to fall over in a wind storm than oak trees. How much can predictive maintenance save? When Arizona Public Service (APS) implemented a transformer oil analysis and notification system at substations to monitor more than 100 critical transformers (230 kV and above), the utility was able to predict and prevent failures far more effectively than it could with other methods. The system uses sensors to monitor the dissolved gas of insulating oil and thereby determine asset health. Other monitoring methods have an effectiveness rate in the 23% to 43% range. The APS system automates both monitoring and analysis METER DATA and operates in near real time, leading to a 93% accuracy rate in failure prediction. This means maintenance can be done without overtime and the lights can stay on for APS customers. Analytics also can deliver strategic insights to improve grid operations. Along with predictive maintenance analytics facilitates integration of renewable generation into the distribution grid without affecting reliability, as well as volt/var control that affects power quality. And, at the end of the day, analytics will improve grid financial planning through better forecasting because it enables engineers to build predictive models for demand planning; plus analytics will help utilities extend distribution asset life and defer investments. ENHANCING SERVICE Speaking of customers, many utilities are applying analytics to their grid operations, but a smaller number are using smart grid data on the customer side of the house. Here, too, is wasted opportunity. Consider the operation and marketing of energy efficiency programs and rates designed for demand management. For such programs to work, you need to have the right program, the right products and they need to be offered to the right people. Analytics will tell utility managers if they’ve managed to get all those factors right. One East Coast utility applied analytics to its energy efficiency programs and discovered that it takes two months from the time a customer first becomes a lead to the point where that same customer completed an energy efficiency project. This insight, combined with analytics that tracked progress against goals, allowed utility managers to see if they were on target to meet financial and regulatory commitments. If not, the managers knew about deficiencies in time to make changes to their programs and marketing. Analytics will play a part in new service offerings, too. Ahead, consumers may start buying smart outlets that let them monitor energy consumption of household appliances. Such energy savers become service opportunities for utilities when the IT team applies analytics. For example, by applying algorithms to look at appliance efficiency, a utility could offer alerts when load curves for a given appliance veer from normal parameters. If we see consumption going up from a fridge, it’s probably an indication that the compressor isn’t working or the seals on the door are starting to fail. The utility can give this maintenance information back to consumers. A service like that would help customers save money and, most likely, boost customer satisfaction scores. THE DATA DRIVEN CORPORATE CULTURE A study conducted by researchers at the Massachusetts Institute of Technology’s Sloan School of Management examined 179 large, publicly traded companies and concluded that firms using data driven decision making “have output and productivity that is 5% to 6% higher than what would be expected given their other investments and information technology usage.” The researchers spotlighted their investigation in a paper titled, “Strength in Numbers: How Does Data Driven Decision Making Affect Firm Performance?” There, they also cited another study, which found that organizations using analytics to guide business decisions and operations are two times more likely to be top performers than other companies. Why aren’t utilities pursing business analytics more actively? Chances are, it’s a people problem. In a May 2011 paper by the McKinsey Global Institute, “Big data: The next frontier for innovation, competition, and productivity”, analysts estimated that organizations will need to fill an additional 140,000 to 190,000 analytical talent positions and 1.5 million positions for data savvy 118 CLASSIC CATEGORIES OF ANALYTICS Descriptive analytics: What has happened or is happening. • Technologies and processes that use data to understand and analyze operational data or business performance. Predictive analytics: Why it happened and what might happen in future. • Extensive use of data and mathematical models to uncover explanatory and predictive models of business performance. Analyze historical data and outcomes to explain why it happened and try to predict what might happen. Prescriptive analytics: Which prediction or outcome is best? • Mathematical modeling techniques that determine a set of high value alternative actions or decisions given a complex set of objectives, requirements and constraints, with the goal of improving business performance. managers in the US alone to take full advantage of the avalanche of data now gaining momentum. Several studies have shown that change management – or the lack of it – can make or break an IT project. For example, investigators at Prosci, an independent research firm focused on change management, found that 95% of organizations with excellent change management programs in place were able to meet or exceed project objectives. Among organizations with poor change management programs, only 16% met or exceeded project objectives. In a recent survey, SAS queried more than 200 utility executives and found that nearly 60% of respondents named change management as the second biggest barrier to implementing analytics software. A third of survey respondents said organizational silos were an issue in their utilities. A truly intelligent utility will apply information technology to energy and service processes to maximize reliability, affordability and sustainability. To do this, utilities must make quantitative analytical capabilities part of the organization’s culture. Everyone, from executives to engineers, must see analytics capabilities as a core competency and competitive differentiator. And, access to information will need to cross functional barriers, something utilities have not yet mastered. Analytics is the lifeblood that will fuel business success. The time has come for utilities to take that tsunami of data coming from the proliferation of intelligent devices on the electrical grid and share it across functional areas so that the right people get the right insights and intelligence when they need it. Until that happens, utilities will be challenged in the effort to drive business value by effectively leveraging information. Still, I have confidence that utilities can make the necessary changes. And, when they do, maybe my friend will quit receiving postcards that try to sign her up for load control on an air-conditioner she does not own. MI ABOUT THE AUTHOR Meir Shargal is part of the leadership team of CSC Global Energy and Utility vertical leading the strategy, “smart” utility, generation and transmission and distribution practices, with a focus on sales and delivery of strategy, business transformation and enterprise solution architecture. He is a multifaceted strategist and technologist with more than 22 years experience who combines innovation with pragmatism, and vision with execution and a sense of urgency. mshargal@csc.com ABOUT THE COMPANY CSC’s Global Utilities Division provides gas, electric and water concerns with utility experience and technical expertise to address today’s challenges including exponential data growth, supply chain risks, cybersecurity, aging workforce and infrastructure, public safety and privacy, regulatory compliance and profitability. Serving the utilities industry for 25 years, CSC clients include 60% of the utilities in the Dow Jones Utility Index. www.csc.com/utilities METERING INTERNATIONAL ISSUE - 3 | 2012


