IB Chemistry Lab Report Format Guide
advertisement
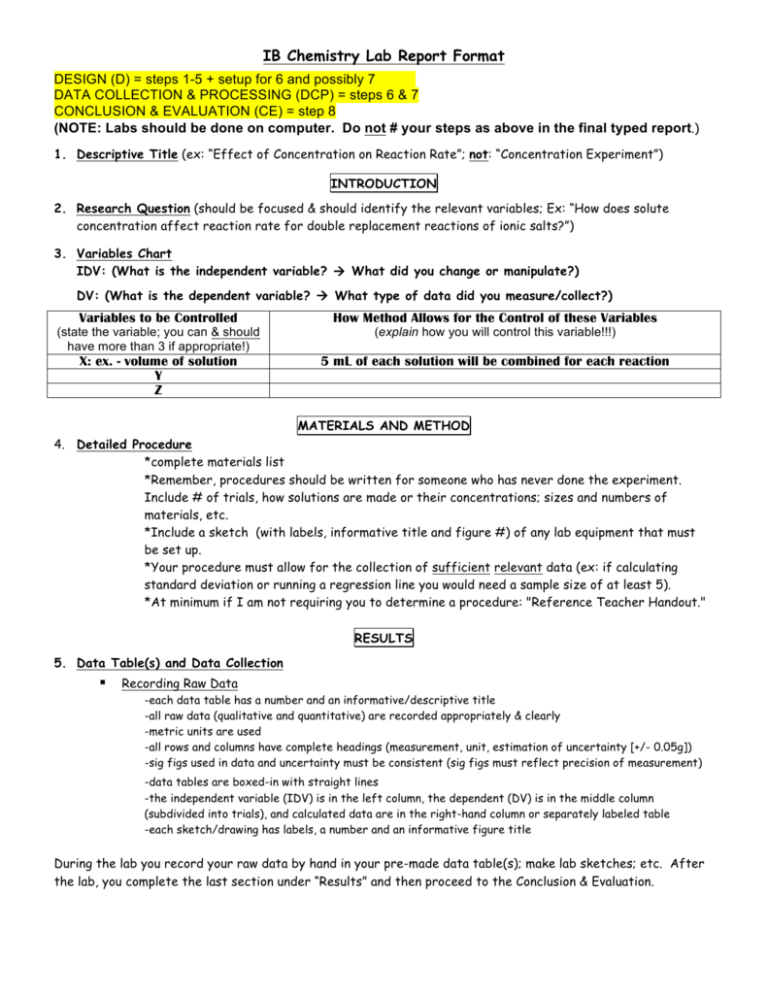
IB Chemistry Lab Report Format DESIGN (D) = steps 1-5 + setup for 6 and possibly 7 DATA COLLECTION & PROCESSING (DCP) = steps 6 & 7 CONCLUSION & EVALUATION (CE) = step 8 (NOTE: Labs should be done on computer. Do not # your steps as above in the final typed report.) 1. Descriptive Title (ex: “Effect of Concentration on Reaction Rate”; not: “Concentration Experiment”) INTRODUCTION 2. Research Question (should be focused & should identify the relevant variables; Ex: “How does solute concentration affect reaction rate for double replacement reactions of ionic salts?”) 3. Variables Chart IDV: (What is the independent variable? à What did you change or manipulate?) DV: (What is the dependent variable? à What type of data did you measure/collect?) Variables to be Controlled How Method Allows for the Control of these Variables (state the variable; you can & should have more than 3 if appropriate!) (explain how you will control this variable!!!) X: ex. - volume of solution Y Z 5 mL of each solution will be combined for each reaction MATERIALS AND METHOD 4. Detailed Procedure *complete materials list *Remember, procedures should be written for someone who has never done the experiment. Include # of trials, how solutions are made or their concentrations; sizes and numbers of materials, etc. *Include a sketch (with labels, informative title and figure #) of any lab equipment that must be set up. *Your procedure must allow for the collection of sufficient relevant data (ex: if calculating standard deviation or running a regression line you would need a sample size of at least 5). *At minimum if I am not requiring you to determine a procedure: "Reference Teacher Handout." RESULTS 5. Data Table(s) and Data Collection § Recording Raw Data -each data table has a number and an informative/descriptive title -all raw data (qualitative and quantitative) are recorded appropriately & clearly -metric units are used -all rows and columns have complete headings (measurement, unit, estimation of uncertainty [+/- 0.05g]) -sig figs used in data and uncertainty must be consistent (sig figs must reflect precision of measurement) -data tables are boxed-in with straight lines -the independent variable (IDV) is in the left column, the dependent (DV) is in the middle column (subdivided into trials), and calculated data are in the right-hand column or separately labeled table -each sketch/drawing has labels, a number and an informative figure title During the lab you record your raw data by hand in your pre-made data table(s); make lab sketches; etc. After the lab, you complete the last section under “Results” and then proceed to the Conclusion & Evaluation. 6. Processing Raw Data: **plotting raw data does NOT constitute processed data!! § Transforming and Manipulating Raw Data -use the most appropriate graph (line, bar, pie) for data -a line or curve has been “fitted” (best-fit) to the points on a line graph (instead of “connecting the dots”) & used to convert raw data to processed data The dotted-line is the “best fit” line which yields the processed data. -data is processed (ex: calculations; calculate % error; etc.) -error is propagated throughout calculations § Presenting the Processed Data -include a sample calculation (title your calculation) -calculated & processed data expressed with correct number of sig figs -show how error propagated through calculations -each graph is numbered and has an informative/ descriptive title -graphs are presented in a professional manner (straight axis lines, appropriate scales on x and y axes); “best fit” line clearly shown -axes are labeled appropriately with units; IDV on the x-axis, DV on the y-axis -bars on a bar graph, or sections of a pie graph are labeled -where relevant, include error bars and uncertainties CONCLUSION and EVALUATION 7. Evaluation/Conclusion § Evaluating Results (Drawing Conclusions) -restate the research question -a summary of your results and uncertainties (include processed data with units) -explain why the experiment resulted in this data; use your knowledge of chemistry! (explanation should contain observations, trends or patterns revealed by the data) -compare experimental results with literature or textbook values (do research & include full references!) § Evaluating Procedure(s) -KEY limitations, weaknesses, or errors are identified and discussed; why could the data be wrong? (NOT trivial errors; ex: “We miscounted.”); comments about precision and accuracy are relevant here -design and method must be commented upon as well as the quality of the data § Modifying the Procedure(s) -specific suggestions to correct the above identified limitations are made to improve the investigation (DO NOT list “We’ll count better.” What would have made data collection or the procedure more precise and better overall?) -modifications should be realistic and clearly specified

