IB Biology Lab Report Format
advertisement
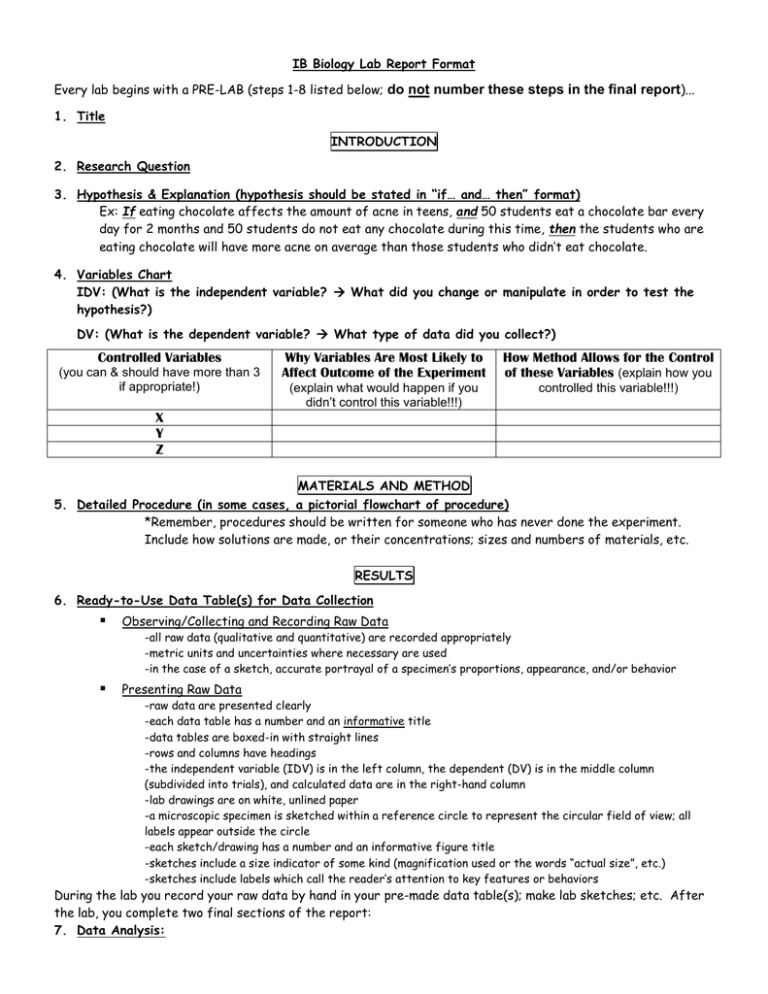
IB Biology Lab Report Format Every lab begins with a PRE-LAB (steps 1-8 listed below; do not number these steps in the final report)... 1. Title INTRODUCTION 2. Research Question 3. Hypothesis & Explanation (hypothesis should be stated in “if… and… then” format) Ex: If eating chocolate affects the amount of acne in teens, and 50 students eat a chocolate bar every day for 2 months and 50 students do not eat any chocolate during this time, then the students who are eating chocolate will have more acne on average than those students who didn’t eat chocolate. 4. Variables Chart IDV: (What is the independent variable? What did you change or manipulate in order to test the hypothesis?) DV: (What is the dependent variable? What type of data did you collect?) Controlled Variables (you can & should have more than 3 if appropriate!) Why Variables Are Most Likely to Affect Outcome of the Experiment How Method Allows for the Control of these Variables (explain how you (explain what would happen if you didn’t control this variable!!!) controlled this variable!!!) X Y Z MATERIALS AND METHOD 5. Detailed Procedure (in some cases, a pictorial flowchart of procedure) *Remember, procedures should be written for someone who has never done the experiment. Include how solutions are made, or their concentrations; sizes and numbers of materials, etc. RESULTS 6. Ready-to-Use Data Table(s) for Data Collection Observing/Collecting and Recording Raw Data -all raw data (qualitative and quantitative) are recorded appropriately -metric units and uncertainties where necessary are used -in the case of a sketch, accurate portrayal of a specimen’s proportions, appearance, and/or behavior Presenting Raw Data -raw data are presented clearly -each data table has a number and an informative title -data tables are boxed-in with straight lines -rows and columns have headings -the independent variable (IDV) is in the left column, the dependent (DV) is in the middle column (subdivided into trials), and calculated data are in the right-hand column -lab drawings are on white, unlined paper -a microscopic specimen is sketched within a reference circle to represent the circular field of view; all labels appear outside the circle -each sketch/drawing has a number and an informative figure title -sketches include a size indicator of some kind (magnification used or the words “actual size”, etc.) -sketches include labels which call the reader’s attention to key features or behaviors During the lab you record your raw data by hand in your pre-made data table(s); make lab sketches; etc. After the lab, you complete two final sections of the report: 7. Data Analysis: Transforming and Manipulating Raw Data -Decide what statistical treatments of the data need to be made... Common to biology will be Chi-Square analysis if you are deciding if the difference between numbers is statistically significant or Two Tiered ttest if you want to compare the means of two groups -use the most appropriate graph (line, bar, pie) for data -a line or curve has been “fitted” (best-fit) to the points on a line graph (instead of “connecting the dots”) -bars on a bar graph, or sections of a pie graph are labeled -include a sample calculation -data is processed (ex: convert into %; calculate % error; 166 bacteria spread over 9 squares (1cm 2 each)= 18.4 bacter/1 cm2) Presenting the Processed Data -graphs are presented in a professional manner (straight axis lines, appropriate scales on x and y axes) -each graph is numbered and has an informative title -axes are labeled appropriately; IDV on the x-axis, DV on the y-axis DISCUSSION / CONCLUSION 8. Evaluation/Conclusion Evaluating Results (Drawing Conclusions) -restate the research question -a summary of what happened (include average numbers with units) -explain why the experiment resulted in this data; use your knowledge of biology!) -explanation of how the data support or refute your original hypothesis -compare results with literature values (do research!) Evaluating Procedure(s) -KEY limitations, weaknesses, or errors are identified and discussed; why could the data be wrong? (NOT trivial errors; ex: “We miscounted.”) Modifying the Procedure(s) -specific suggestions to correct the identified limitations are made to improve the investigation (DO NOT list “We’ll count better.” What would have made data collection or the procedure more precise and better overall?)

