AP STATISTICS FINAL PROJECT
advertisement
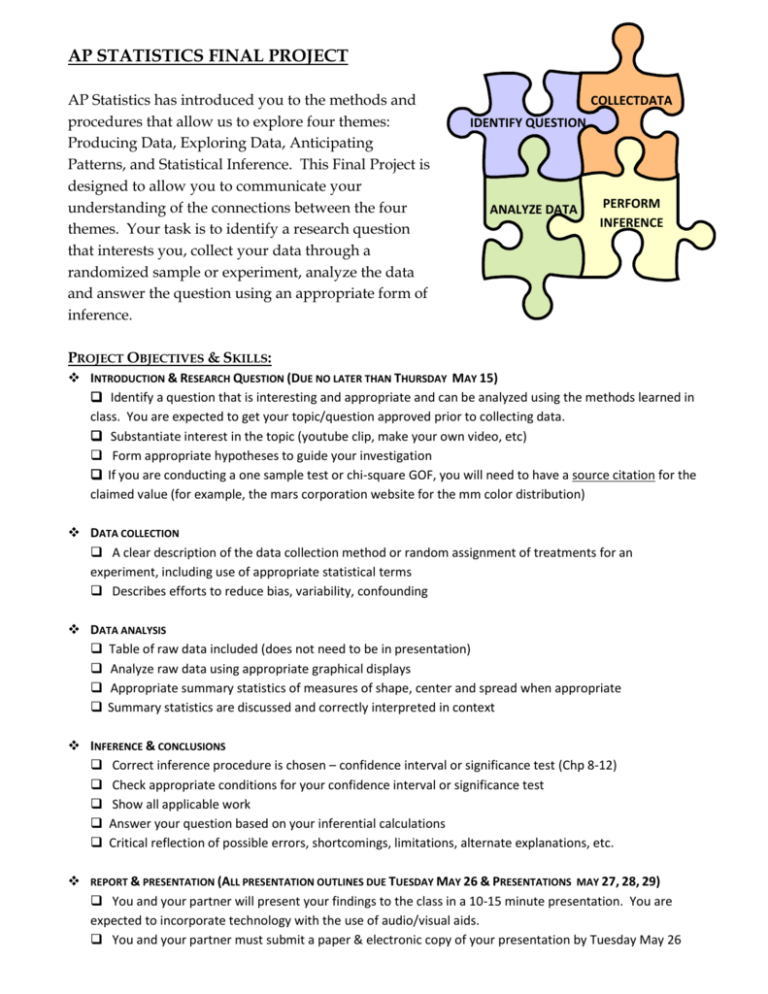
AP STATISTICS FINAL PROJECT AP Statistics has introduced you to the methods and procedures that allow us to explore four themes: Producing Data, Exploring Data, Anticipating Patterns, and Statistical Inference. This Final Project is designed to allow you to communicate your understanding of the connections between the four themes. Your task is to identify a research question that interests you, collect your data through a randomized sample or experiment, analyze the data and answer the question using an appropriate form of inference. COLLECTDATA IDENTIFY QUESTION ANALYZE DATA PERFORM INFERENCE PROJECT OBJECTIVES & SKILLS: INTRODUCTION & RESEARCH QUESTION (DUE NO LATER THAN THURSDAY MAY 15) Identify a question that is interesting and appropriate and can be analyzed using the methods learned in class. You are expected to get your topic/question approved prior to collecting data. Substantiate interest in the topic (youtube clip, make your own video, etc) Form appropriate hypotheses to guide your investigation If you are conducting a one sample test or chi-square GOF, you will need to have a source citation for the claimed value (for example, the mars corporation website for the mm color distribution) DATA COLLECTION A clear description of the data collection method or random assignment of treatments for an experiment, including use of appropriate statistical terms Describes efforts to reduce bias, variability, confounding DATA ANALYSIS Table of raw data included (does not need to be in presentation) Analyze raw data using appropriate graphical displays Appropriate summary statistics of measures of shape, center and spread when appropriate Summary statistics are discussed and correctly interpreted in context INFERENCE & CONCLUSIONS Correct inference procedure is chosen – confidence interval or significance test (Chp 8-12) Check appropriate conditions for your confidence interval or significance test Show all applicable work Answer your question based on your inferential calculations Critical reflection of possible errors, shortcomings, limitations, alternate explanations, etc. REPORT & PRESENTATION (ALL PRESENTATION OUTLINES DUE TUESDAY MAY 26 & PRESENTATIONS MAY 27, 28, 29) You and your partner will present your findings to the class in a 10-15 minute presentation. You are expected to incorporate technology with the use of audio/visual aids. You and your partner must submit a paper & electronic copy of your presentation by Tuesday May 26 PROJECT PROPOSAL-DUE NO LATER THAN MONDAY MAY 18 NAME (S):__________________________________ _________________________________________ RESEARCH QUESTION: What do you intend to answer through this project? INFERENCE: What is your parameter of interest? What form of inference will you use? State your hypotheses PROPOSED DATA COLLECTION: How will you go about collecting your data? What supplies will you need? Be specific! TEACHER APPROVAL: ________: OK-Begin your data collection ________: Not OK-See below for suggestions. Resubmit for approval PROJECT GRADING - ATTACH THIS RUBRIC TO THE TOP OF YOUR PAPER NAME:___________________________________ 1 PROJECT Introduction of research question, including substantiating interest of topic 2 3 4 5 6 7 1 2 3 4 5 6 7 1 2 3 4 5 6 7 Graphical Displays & Summary Statistics of analyzed data 1 2 3 4 5 6 7 Description of inference method & conditions check 1 2 3 4 5 6 7 12 14 Statement of null & alternate hypotheses 3 Description of data collection processrandomization, bias, variability, confounding (data collected from online sources must be cited) 5 6 Correct inference calculations 7 Statement of results in statistical terms & context 8 10 11 7 = HIGHEST 1 2 4 SCALE: 1 = LOWEST 2 4 6 8 10 1 2 3 4 5 6 7 Critical Reflection of errors, shortcomings, limitations, etc 1 2 3 4 5 6 7 Effective & professional communication and appearance 1 2 3 4 5 6 7 15 20 25 30 Well prepared presentation containing items 1-8 above + raw data (A printed & electronic copy must be submitted by Tuesday May 26) 0 5 10 Total: ____________ /100 POSSIBLE PROJECT TOPICS Comparison of gasoline prices in Detroit vs suburban prices Lengths of Hit songs compared to “no longer than three minutes and thirty seconds” Ounce of coke in cans or chips in bag, etc Proportion of drivers who text or use cell phone while driving Distribution of skittles colors Anything using this winter’s Olympic data Braking endurance of repeated stops Comparison of costs for flights scheduled 7 days in advance to 30 days in advance Blood pressure in right arm vs left arm Self- reported height of males (or females) vs actual height Drive through times at two fast food restaurants Compare cars at Sam’s Club to those parked at Costco or Wal-Mart, Meijer, Target Taste comparison of tap water to bottled water or comparison of brands of bottled water Is there a (linear) relationship between the cost of bottled water and the taste Strength of paper towel or facial tissue between brands Look through your textbook, quizzes, tests, notes, or online to look for problems you may want to recreate and collect your own data.

