AP STATS FINAL PROJECT DESCRIPTION
advertisement
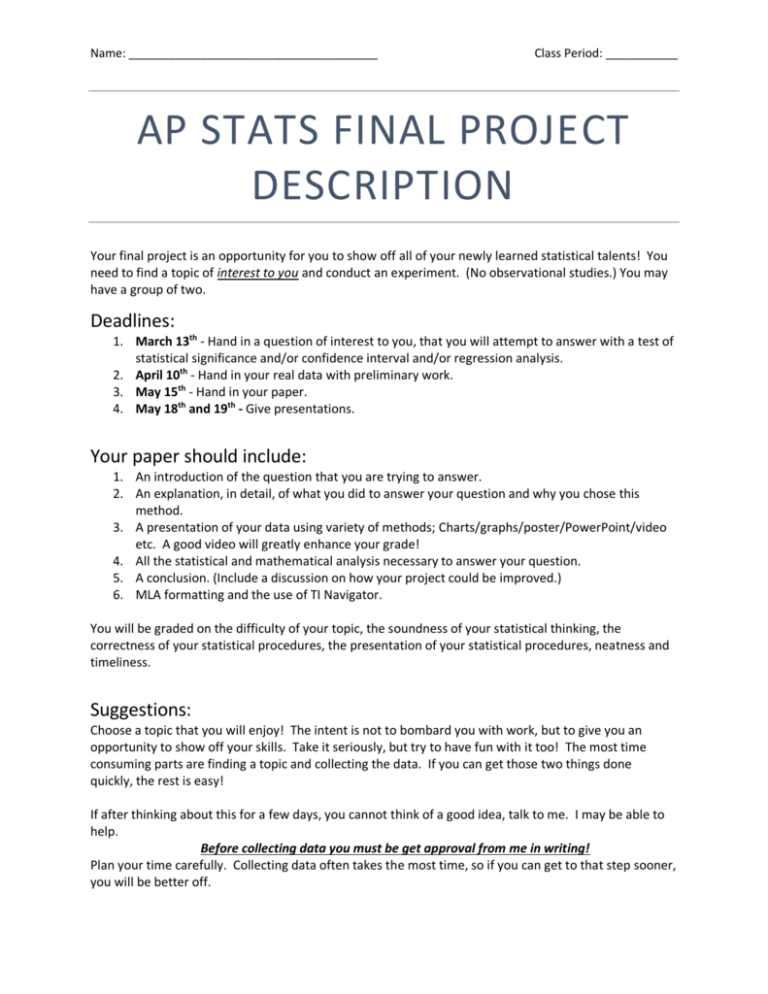
Name: ______________________________________ Class Period: ___________ AP STATS FINAL PROJECT DESCRIPTION Your final project is an opportunity for you to show off all of your newly learned statistical talents! You need to find a topic of interest to you and conduct an experiment. (No observational studies.) You may have a group of two. Deadlines: 1. March 13th - Hand in a question of interest to you, that you will attempt to answer with a test of statistical significance and/or confidence interval and/or regression analysis. 2. April 10th - Hand in your real data with preliminary work. 3. May 15th - Hand in your paper. 4. May 18th and 19th - Give presentations. Your paper should include: 1. An introduction of the question that you are trying to answer. 2. An explanation, in detail, of what you did to answer your question and why you chose this method. 3. A presentation of your data using variety of methods; Charts/graphs/poster/PowerPoint/video etc. A good video will greatly enhance your grade! 4. All the statistical and mathematical analysis necessary to answer your question. 5. A conclusion. (Include a discussion on how your project could be improved.) 6. MLA formatting and the use of TI Navigator. You will be graded on the difficulty of your topic, the soundness of your statistical thinking, the correctness of your statistical procedures, the presentation of your statistical procedures, neatness and timeliness. Suggestions: Choose a topic that you will enjoy! The intent is not to bombard you with work, but to give you an opportunity to show off your skills. Take it seriously, but try to have fun with it too! The most time consuming parts are finding a topic and collecting the data. If you can get those two things done quickly, the rest is easy! If after thinking about this for a few days, you cannot think of a good idea, talk to me. I may be able to help. Before collecting data you must be get approval from me in writing! Plan your time carefully. Collecting data often takes the most time, so if you can get to that step sooner, you will be better off. Name: ______________________________________ Class Period: ___________ AP Statistics Sample Final Project Questions Try to think of your own interesting question, but if you’re stuck, you can modify one of mine. Does changing your appearance change people’s reaction to you? Is gender related to…? Do after school jobs or sports affect grades? (Retrospective) Study time vs. ……? Store brands vs. generic. Green cleaners vs. non-green cleaners. Taste of food or beverage vs. container type. Does reading your horoscope affect your day? Reaction time vs. food intake, sleep, exercise.....etc. Is gender related to success on multiple choice vs. essay or short answer? The following ideas introduce response bias and are some other examples ideas: “Cartoons”, by Sean Wu and Brian Hartzheim 1. “Do you watch cartoons?” (90% yes) 2. “Do you still watch cartoons?” (60% yes) “Milk vs. Orange Juice”, by Angela Chen and Sharon Lai 1. “Which do you prefer, milk or orange juice, as a breakfast drink?” (milk: 14%) 2. “Milk contains high levels of vitamin D and calcium. Do you prefer milk or orange juice as a breakfast drink?” (milk: 64%) “Cheating”, by Wilson Kurniawidjaja, Oliver Lee, and Charlene Wang 1. “Do you cheat in class?” (anonymous: 47% would) 2. “Do you cheat in class?” (not anonymous: 15% would) “Make-Up”, by Caryn Suryamega and Trisha Tsuno (all questions asked to males) 1. “Do you find females who wear makeup attractive?” (wearing makeup: 75% yes) 2. “Do you find females who wear makeup attractive?” (without wearing makeup: 30% yes) “Time Online”, by Yale Lee and Helen Theung 1. “On average, how many hours do you spend online each week: 0-5, 6-10, 11-16, 17-25, 26-35, or more?” 2. “On average, how many hours do you spend online each week: 0-5, 6-10, 11-16, or more?” -For this question, the students anticipated that subjects would be embarrassed to put “more”. In the first question, 50% answered over 17 hours, but in the second question, 0% did. Question of Interest: _________________________________________________________________________________________ _________________________________________________________________________________________ _________________________________________________________________________________________ _________________________________________________________________________________________ Ms. Mozal’s Approval: ______________________________________________________________________ Name: ______________________________________ Class Period: ___________ AP STATS FINAL PROJECT RUBRIC Total Score out of 33: ____________. Code: 3 2 1 0 Excellent Good Satisfactory Unsatisfactory Overall 1. _____ Followed instructions for the investigation 2. _____ Report has introduction, analysis and conclusion 3. _____ Grammatically correct and free of spelling mistakes 4. _____ Clarity 5. _____ Neatness (Software used) 6. _____ Interesting Data? 7. _____ Technical specs. (HT or CI with formulas etc.) 8. _____ Visual evidence, graph etc. 9. _____ On Time? 10. _____ Presentation 11. _____ Challenging Project? Bonus: Movie? Poster? What makes a good presentation? - Does not merely read what is shown - Appears to know what s/he is talking about - Avoids fidgeting/swaying - Avoids monotone - Concise (avoids rambling) - Limits um, uh, and - Confident - Enthusiastic - Funny - Involves audience - Keeps audience interested - Make eye contact - Speaks clearly
