Bank Asset/Liability Management
....J I EXHIBIT2. STATISTICALANALYSISOF EARNINGSAND MARKETRATES
Category
Yield(TE)
COF
NIM(TE)
ROA
FedFunds
85%
92%
-45%
-9%
BOllYield
66%
Correlation
Matrix
Spread
5 yr.UST
9%
88%
2%
93%
22%
-33%
5%
-4%
73%
12%
. Correlation; and
.Correlation
Sensitivi!Y {ats_oknown aw~pe.-Ql"beta L=
measures the tendency for two factors to
\-I
\.-I
move together. For the purposes of hedge accounting
(i.e., SFAS 133), the correlation between a derivative
instrument and the financial product being hedged, a
correlation of 80 percent is required for the hedge to
be effective. When there is a correlation of around
80 percent between a market rate and bank performance metric, we will suggest that it is a good fit.
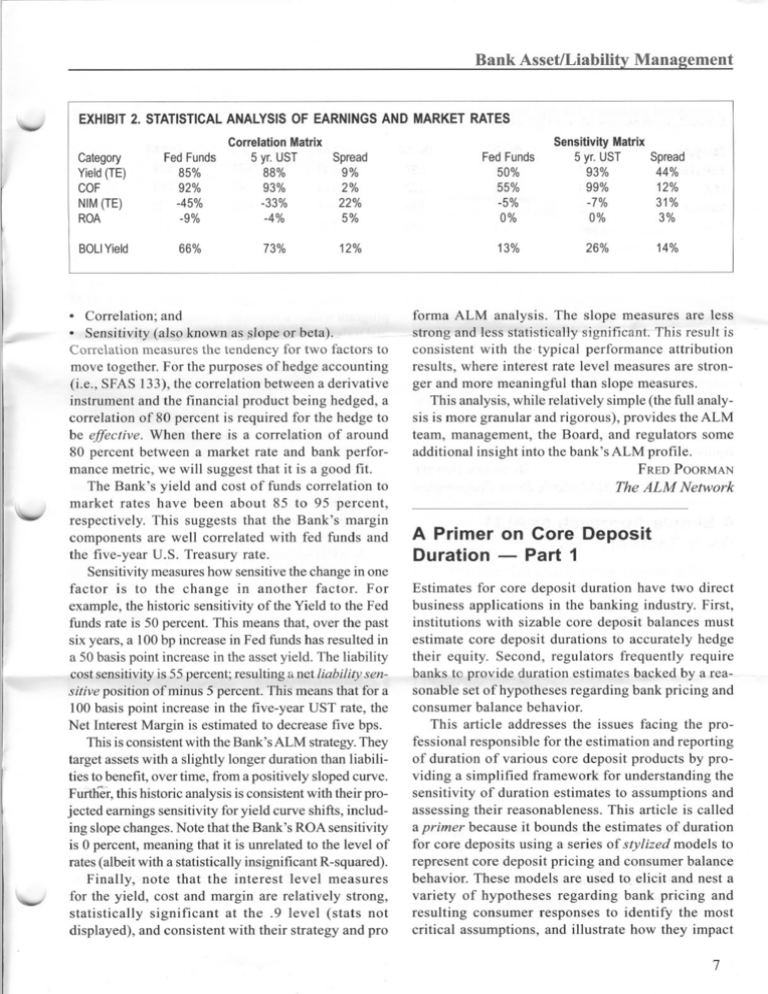
The Bank's yield and cost of funds correlation to
market rates have been about 85 to 95 percent,
respectively. This suggests that the Bank's margin
components are well correlated with fed funds and
the five-year U.S. Treasury rate.
Sensitivitymeasures how sensitive the change in one
factor is to the change in another factor. For
example, the historic sensitivity of the Yield to the Fed
funds rate is 50 percent. This means that, over the past
six years, a 100 bp increase in Fed funds has resulted in
a 50 basis point increase in the asset yield. The liability
cost sensitivity is 55percent; resulting a net liability sensitive position of minus 5 percent. This means that for a
100 basis point increase in the five-year UST rate, the
Net Interest Margin is estimated to decrease five bps.
This is consistent with the Bank's ALM strategy.They
target assets with a slightly longer duration than liabilities to benefit, over time, :troma positively sloped curve.
Furtller,this historic analysis is consistent with their projected earnings sensitivity for yield curve shifts, including slope changes. Note that the Bank's ROA sensitivity
is 0 percent, meaning that it is unrelated to the level of
rates (albeit with a statistically insignificant R-squared).
Finally, note that the interest level measures
for the yield, cost and margin are relatively strong,
statistically significant at the. 9 level (stats not
displayed), and consistent with their strategy and pro
FedFunds
50%
55%
-5%
0%
13%
SensitivityMatrix
Spread
5 yr. UST
93%
44%
99%
12%
-7%
31%
0%
3%
26%
14%
forma ALM analysis. The slope measures are less
- .strong-oand,.less
statistie-aHy-significant-Thisresult is
consistent with the typical performance attribution
results, where interest rate level measures are stronger and more meaningful than slope measures.
This analysis, while relatively simple (the full analysis is more granular and rigorous), provides the ALM
team, management, the Board, and regulators some
additional insight into the bank'sALM profile.
FREDPOORMAN
The ALM Network
A Primer on Core Deposit
Duration - Part 1
Estimates for core deposit duration have two direct
business applications in the banking industry. First,
institutions with sizable core deposit balances must
estimate core deposit durations to accurately hedge
their equity. Second, regulators frequently require
banks to provide ?uration estimates backed by a reasonable set of hypotheses regarding bank pricing and
consumer balance behavior.
This article addresses the issues facing the professional responsible for the estimation and reporting
of duration of various core deposit products by providing a simplified framework for understanding the
sensitivity of duration estimates to assumptions and
assessing their reasonableness. This article is called
a primer because it bounds the estimates of duration
for core deposits using a series of stylized models to
represent core deposit pricing and consumer balance
behavior. These models are used to elicit and nest a
variety of hypotheses regarding bank pricing and
resulting consumer responses to identify the most
critical assumptions, and illustrate how they impact
7
Bank Asset/Liability Management
the estimated durations. The article concludes with a
cautionary note regarding the potential for destabilizing duration models created by embedding rate sensitive balance behavior into them.
The models we use to explore the effects of bank
pricing and cons:umerresponses on duration estimates
can each be replicated in a spreadsheet. While more
complex models exist and may be required for a specific modeling purpose (for example, models of core
deposits utilized in stochastic interest rate generation
systems require additional equations if rates among
the models are to behave consistent with tier pricing
structures), these stylized models simulate the reasonableness of far more complex calculations and can
help ALM practitioners to understand and explain to
senior management the key determinants underlying
core deposit duration estimates.
In Section I, the textbook definition of effective duration applicable to core deposits is presented. In Section
II, a simplified rate model described in Hawkins and
Arnold (see September 2000 BALM "Relaxation Processes in Administered Rate Pricing" Physics Review
E) is described to capture several key aspects of bank
pricing behavior and show that one ofthe four standard
rate parameters dominates the others. In Section III, a
stylized model ofnite sensitive balances to the stylized
rate model is added. A simple model is shown of how
balance sensitivity can significantly complicate the duration calculation and its interpretation.
This article is divided into three parts. Part 1 in this
issue will present Section I: The Textbook Definition
of Effective Duration.
-Section -I:-The Textbook Definition. of Effective
Duration. A simple definition of effective duration is:
Effective Duration or D = ilNPV/(NPV.M)
... (1)
This example illustrates how effective duration is
calculated. Suppose we have a $100 5-year bond carrying'a fixed coupon of 5 percent paid semiannually;
further assume the current discount rate is constant
at 5 percent. The duration of the bond following a 1
bp parallel shift in interest rates is 4.37 years. The
calculation is: 4.37 = - (-.0437)/(100*.0001). Note that
all we did in this calculation was to write down the
cash flows and discount the cash flows twice. Also
note that even a fixed coupon bond has convexity. If
we had shifted interest rates by 10 bps instead of 1
bp, we would have calculated a slightly different value
for duration.
Part 2 of this series will address Rate Models and
Core Deposit Duration (Section II).
v
MICHAEL R. ARNOLD, PRINCIPAL,
ALCO Partners, LLC
ALM Training-Update
and
Call for Vendors
REPLY REQUESTED BY JUNE 15, 2006
One important way to assure a comprehensive ALM
program within a financial institution is through formal training. Training is crucial to the achievement of
the objectives for any bank's ALM staff. Accordingly,
BALM plans to present the second annual sampling of
the more prominent ALM training practitioners, with
a brief overview of each.
ALM training programs, designed specifically for
bank AIL managers and their staffs, can assist in defining, measuring, monitoring and managing exposure
to interest rate and liquidity risks. Successful completion of training can provide bank ALM professionals
with the knowledge of what needs to be done, as well
as the tools to enhance their bank's profitability.
Training institutions interested in being included in
future ALM training article updates and profiles, or
those who have any changes to last August's BALM
listing, should contact SCI no later than June 15,2006,
at (704) 541-0489 or SECI@aol.com.
Bank
Asset/Liability
Management
Editor
Peter A. Mihaltian
President and COO
Southeast Consulting,
Inc.
PO Box 470886
Charlotte NC 28247-0886
Telephone: (704) 541-0489
Fax: (704) 541-0661
E-mail: seci@aol.com
Website:
http://www.southeastconsulting.com
'
J
~
Publisher's
Staff
Managiug
Editor
Adam McNally
Mauuscript
Editor
Erin Lee
Editorial
Inquiries
Peter A. Mihaltian
BANK ASSET/LIABILITY MANAGEMENT (ISSN 0896-65230) is published munthly by
A.S. Pratt & Sons Group, 1725 K St., N.W., Suite 700. Washington, D.C. 20006. Copyright
2006 by ALEX eSOLUTIONS, INC. All rights reserved. No part of this newsletter may be
reproduced in any form by microfilm, xerography, or otherwise incorporated into any
information retrieval system without the written permission of the copyright owner. Requests to reproduce material contained in the publications should be addressed to Copyright
Clearance Center, 222 Rosewood Drive, Danvers MA 01923, (978) 750-8400, fax (978)
750-4470. For customer service information, call (800) 572-2797. EDITORIAL INQUIRIES: Direct to SCI.
"-.J
POSTMASTER: Send address changes to BANK ASSET/LIABILITY MANAGEMENT,
1725 K St., N.W, Suite 700, Washington, D.C. 20006.
8
805
Bank Asset/Liability Management
\-v
environment
as well as changes in membership
composition. In some ways the tighter capital requirements
echo the constraints being placed on Fannie Mae and Freddie
Mac by their regulator, the Office of Federal Housing Enterprise Oversight (OFHEO). Like their GSE brethren, this
regulatory scrutiny is born of rising concern in Washington and among their private-sector competitors that these
institutions are abusing their privileged status in the capital markets to expand their activities beyond their core
missions and reap arbitrage profits. This scrutiny is not
likely to abate soon.
While the FHFB's proposed rule will have far-reaching implications for the 12 regional FHLBs, the result-
ing impact to members may not be as severe as some
v
had previously thought. The biggest impact to members
may come in the form of reduced dividend payments
while their respective FHLB builds its retained earnings
to the prescribed minimum. The possibility of the FHLBs
liquidating substantial MBS holdings to meet the 1 [0posed rule may be over-stated and should not be significant enough to impact on its own the MBS
market. However, restrictions on the size of the MBS
portfolios held by Fannie Mae and Freddie Mac (as
currently proposed), coupled with a similar pay-down
of MBS balances at the FHLBs, would most likely create enough reduction in aggregate demand for mortgage
product to drive spreads materially higher.
Thus, financial institution managers should determine
the minimum level of investment in FHLB stock based
on their respective
FHLB's
requirements
and
consider redeeming any excess that exists so as to minimize the impact of reduced dividend payments if the
proposed rule is adopted.
TOM FITZGERALD
SunTrust
I~
Section II-Rate Models and Core Deposit Duration.
Core deposit rates and balances are notoriously path dependent. While best practice requires the use of stochastic rates to estimate the duration of a core deposit balance, most institutions lack the in-house modeling resources to build models that will work satisfactorily using stochastic interest rates. (The author built models of
core deposits to be utilized in a major U.S. bank's proprietary risk measurement system in the 1990s.) Hence, the
remainder of these two article parts will explore how du~
rationestimate-svaryusingsinglescenario-analyses."
-=
To calculate the duration of a core deposit, a model
is required to describe the response of bank deposit
rates to changes in market rates. We use LIBOR forward rates as tht? market rate for this stylized model.
Since we can also use the LIBOR forward rates to discount future cash flows, forward rates turn out to be a
key input for most models of duration.
While different forward curves can impact the
discounted value of a core deposit, the choice of rates has
less impact on the calculation of duration than some of the
key behavioral parameters. This is because the second rate
path used to estimate duration is a function of the first rate
path. If we replace the constant 5 percC'~t discount
rate assumption (see example in Part 1) with a positively
sloped yield curve, then the estimate of duration changes by
a small amount. We calculate the duration as 4.18 years,
based on the forward curve utilized throughout the rest of
this article. This is consistent with the convexity of a bond,
where duration declines with lower interest rates.
AND JON KOZLOWSKI
Robinson
Humphrey
A Primer on Core Deposit
Duration (Part 2)
'v
bank pricing behavior. One of the four standard rate
parameters will be shown to dominate the others.
The issues facing the asset/liability (A/L) professional
responsible for the estimation and reporting of duration
of various core deposit products are numerous and complicat~. By providing a simplified framework for understanding the sensitivity of duration estimates to assumptions, and assessing their reasonableness, the A/L
professional can take a more organized approach with
these issues. This series of articles contains three sections. Part 1 discussed Section I, the textbook definition of effective duration applicable to core deposits (see
BALM June 2006, p. 7). This Part 2 article discusses a
simplified rate model to capture several key aspects of
0 Modeling Deposit Rates as a Floater and Floater with
a Spread. Rather than a fixed coupon and a bond,
suppose we have a deposit balance that has a floating
rate. If deposit is a pure floater (the rate reprices at least
monthly, which is usually the shortest period used to model
core deposit rates) and forward rates are used in the calculation to generate the deposit rate, the deposit will have
zero duration. Changing the forward rates does not change
this conclusion, nor does changing the liability's maturity.
For example, high tier money market accounts will
almost by definition have short durations, independent of
what is assumed about customer balance responses.
If the deposit rate is below LIBOR, or the respective
discount curve, such as in equation (2) below (equation 1
is shown in Part 1 of this article series), duration is 'not
equal to zero.
(2) Deposit rate
= 1M LlBOR rate -
constant spread(2)
3
= =
Bank Asset/Liability Management
EXHIBIT3. RELATIONSHIP
BETWEENBALANCEAND
RATEASSUMPTIONS
EXHIBIT2. ILLUSTRATIVEDEPOSITRATEFUNCTIONS
When the deposit rate is below LIBOR, where LIBOR
is the implicit cost of funds for the institution, there is an
implicit annuity in the calculation of duration. This asset
is the so-called core deposit intangible. While it has a relatively small impact on duration, it is important to
recognize that it has the opposite sign from all the other
rate parameters impacting duration. In other words, if
equation (2) describes the evolution of the deposit rate,
the duration of the deposit is a small positive number,
reflecting the duration of the implied annuity stream
associated with the constant spread. Under these
circumstances, balance assumptions will have only minor
effects on the duration values.
I~
0 A Floater with a Spread that Increases with the Level
oj Interest Rates. The next variant of the deposit rate model
..".~ accounts 'for the propo-fttonality Janor. This factor
describes the case when the difference between the
deposit rate and market rate, hereinafter referred to as the
deposit pricing spread, is a function of the market rate
level. The proportionality construct can be represented in
two ways.
First, we define the deposit rate algebraically as:
(3)j?eposit rate = [Proportionality
- constant spread.
Factor
*
1M USOR rate]
where,
0 ~ ProportionalityFactor:::; 1.0 and Deposit rate
Next, we illustrate equation (3) in Exhibit 2, using various values for the proportionality factor. As indicated, there
are three lines. The 45 degree line (the thick line in Exhibit
2) represents the points of a pure floater and deposit rates
4
-
v
equal market rates at all rate levels. The dashed line below
and parallel to the 45 degree line represents a pure floater
with a constant spread. The third line (the thin line in Exhibit 2) is flatter than the other lines and represents a pure
floater with a rate that is a proportion of the market rate.
All deposit rates are subject to a lower boundary of zero.
When duration is calculated in the proportional pricing,
J,
case, it is necessary to make a statement about balances. 'JI
Whenever deposit pricing is based on a proportionality
factor, the balance maturity profile, or runoff assumption,
impacts duration.
In Exhibit 3, we represent the relationship between balance maturity profiles and the proportionality assumption.
T\' J balance profiles are presented to illustrate how
balance maturity and rate setting behaviors interact in this
simplified framework. Duration is calculated for a range of
-'"
proportionality factors-(from~ 0 to 1) using a 5-year and
lO-year constant balance profile. As indicated in this simple
deposit pricing assumption, lower proportionality factors have
greater effects on balance assumptions. This turns out to
be a key finding: duration calculations are dependent
on the interplay between rate and balance maturity
assumptions when the rate model incorporates a
proportionality factor significantly less than 1.
When the deposit rate is constant, that is, the proportionality factor is zero, the balance profile translates directly to the duration calculation. On the other hand, when
the deposit rate more closely tracks the market rate with a
constant spread, the balance maturity assumptions have
less impact on the duration calculation. In business terms:
balance maturity assumptions have little impact on
high-tier money market accounts. They have greater ' J;
significance on DDA or savings accounts with rates that
do not adjust to market rates.
Bank Asset/Liability l\'Ianagement
~
EXHIBIT4.
PartialResponse
DepositPricingModel
I. SteadyStateDepositPricing
Assumption:
(4) DepositRate(t)*= Spread+ Proportionality
Factorx MarketRate(t)*
II. Deposit
RateAdjustmentAssumptions
(5) DepositRate(t)=DepositRate(t-1)+AdLspeed(a,b)x[Deposit
Rate*(t)-DepositRate(t-1)]
where,
*indicates
asteadystatevalue(thisconstruct
isusedtocreatestability.Itistheanswertothequestion,
"Whatwillthedepositratebe
shouldmarketratesevolvetoaspecificlevelandremainthere?")
AdLspeed(a,b)
hastwovalues,reflecting
whendepositratesareabove(a)orbelow(b)thesteadystatevalue.Botharebetween
zeroandone.
--~ ~
=- -=0= =
~ ~~~ ~ ~ -""""..,
" - ~=
==
=-='=,-'-=--.~~
EXHIBIT5.
IMPACTOF
PRICINGLAGS
ONDURATION
OFCORE
DEPOSITS
-5 Yr Maturity
Pricing Lag Impact on Duration
P~icingLagJmpact
,..
.1 J .~.~.~~~.-:~:~.~~~~~~
ij
""""
i. :::1
~-""",-
f
"'"
"""~,~
'5
-.~.~.c~~:>::,:::::
.6
.7
-7
.8
. _,8
-9
:':>~"
.9
1
M
M
~
M
Proportionality
v
-10 Yr Maturity
on Duration
0
~
c
~
-
M
M
M
Facto'
0 Deposit Pricing Lags. Most banks set deposit rates 'Jy
committee, after considering market conditions and CO.I1petitor pricing responses. This process results in pricing
lags that are consistent with the widely held perception
that banks are slower to raise deposit rates in response to
an increase in market rates than they are to lower deposit
rates in response to a decline in market rates. This behavior is commonly referred to as an asymmetric pricing lag.
As will be shown, after accounting for the proportionality
factor in equation (3), pricing lags have only a small impact on duration calculations.
Building a model that incorporates asymmetric pricing
lags is a little bit more complex than equation (3) above.
For this exercise a partial response model is used specified'in two equations. (Exhibit 4).
The model described in Exhibit 4 can be applied to
actual data series and estimated using the EXCEL Solver
tool. In addition, it captures a broad set of pricing characteristics and forecasts when forecast variables are used to
estimate coefficients.
Equation (5) represents a long-term relationship that
can be graphed as shown in Exhibit 3. When data is
~
~
1
0.6
Proportionality
0.5
0.4
0.3
0.2
0.1
Factor
utilized, the difference between the value in equation
(5) and the previous time period's deposit rate is the
basis for the adjustment. If the adjustment speed is 1.0,
then the model converges to Equation (4). If the adjustment speed is zero, the rate remains constant at its
current value.
The graphs in Exhibit 5 display how pricing lags affect
duration. As indicated, the addition of pricing lags impacts
the duration calculation, but does so in non-intuitive ways.
If adjustment speeds are above 0.25 (indicating a 25 percent adjustment in each period), the effects are small.
However, as adjustment speeds lengthen and approach but
do not become zero, the effect is greater on products with
rates described by higher proportionality factors. This is
because lower proportionality factors and pricing lags have
similar, but not identical, effects on simulated deposit rates.
When a proportionality factor is present, the addition of
pricing lags does not add significantly to duration. Alternatively, when the proportionality factor approaches one,
adding a significant pricing lag lengthens duration noticeably. The relative effects do not vary significantly by what
is assumed about balance maturity.
5
Bank Asset/Liability Management
Part 3 of this series will discuss Section III-Balance
Sensitivity Assumptions and Core Deposit Duration.
MICHAELR. ARNOLD,PRINCIPAL,
.
ALCO Partners, LLC
AssetlLiabi Iity Management
Training Update
Formal training is an important way to guarantee that your
financial institution maintains a comprehensive AIL management (ALM) program. Training is crucial to the
achievement of the numerous objectives for any bank's
AIL management staff. Accordingly, this article presents
an update of ALM training vendors and programs designed
specifically for bank AIL managers and their staffs.
Comprehensive training courses should include a number of components in their programs, including goals,
policies, procedures and systems; evaluating, selecting and
installing ALM models; gap analysis; income simulation
analysis; and more. Courses should be designed so that
any member of the AIL team, regardless of experience
level, can attend. Novices can be introduced to the training
that is necessary in this field, while experienced analysts
and managers can update their skills and knowledge.
Training Course Offerings. There are numerous training courses and seminars from which to choose. Listed
below is a sampling and update of the more prominent
ALM training practitioners, with a brief overview of each.
0 BancWare (Stephen M. Roy, 617-542-2800 x248,
www.bancware.com). A leader in balance sheet management
software, offerings include the following courses for 2006:
ALM Overview: Theory and Practice. Move from
model design to value creation through practical
applications. Includes IRR management, stochastic
simulation, OAS valuation, non-maturity deposit
modeling, EVE, liquidity risk management, FTP, and
model risk management principles.
Basic ALM 4. Obtain a strong grasp on the basic
functionality of ALM 4 software. Provides hands-on
training on all basic aspects of ALM 4. Learn how to
define a model, build chart of accounts, load data into
.
.
. the model, etc.
.
6
.
Advanced ALM 4. Build upon Basic ALM 4 skills.
Provides user with hands-on training on all advanced
aspects cifALM 4. Learn about advanced directive and
report writing,' troubleshooting techniques and more.
Basic BancWare Data Integration. Obtain a strong
grasp on basic functionality of BDI software.
Provides hands-on training on all basic aspects of
Convergence.
Basic ALM 5. Obtain strong grasp on basic functionality of ALM 5 software. Provides hands-on training
on all basic aspects of ALM. Learn how to build
dimensions, load data into model, build chart of
accounts; etc.
J
0 BNK
Advisory
Group,
Inc.
(Update)
(www.bnkadvisorygroup.com).
BNK has worked with
banks from de novos to super-regionals and has presented
our approach at leading conferences. The following
represents offerings in ALM education and training:
Board education, ranging from ALM 101 through
ALM 801 (intro to ALM; what is EVE and why
should we care; ALM metrics for Board reporting)
ALCO (assessing and developing an integrated risk
management framework for institutions; developing
and reviewing policies; setting policy limits; using an
ALM risk dashpoard; regulatory insight; ALCO
assessment, education, and training; developing an
ALCO charter; and results-focused reporting
ALM staff education and training (needs assessment
and model selection; consulting and implementation
services; results-focused reporting; pricing core
deposits and core deposit analysis; and database
management. )
.
.
.
0 Darling
Consulting
Group,
Inc. (Update)
(www.darlingconsultling.com. 978-463-0400). With more
than 25 years of experience providing ALM education and
training to financial institutions across the country, DCG's
educational programs are considered the industry benchmark. In addition to providing custom-tailored, in-house
seminars for financial institutions, DCG conducts
numerous onsite, Web and phone-based educational
programs for many natJonal, regional and state bank,}ng
associations, regulatory agencies, and the FHLBs. DCG
also participates
in quarterly examiner training
programs facilitated through the Federal Financial Institutions Examination Council's (FFIEC). DCG's Balance
Sheet Management Conference, held annually in June, has
become one of the industry's most respected ALM events.
Following is a partial list of speaking topics:
Core ALM Education for Management and Directors
(ALM Policy Development From a Business Perspective; Liquidity Measurement and Management; Measuring and Managing Interest Rate Risk (IRR); Developing
and DocumentingBalance SheetManagement Strategies;
Risk/Return Trade-offs in Balance Sheet Management;
Risk Management for the Bank Director; Effective
Use of the ALCO Process; High Performing ALCOs:
What Separates the Best From the Rest)
Strategy-Development Workshops (Balance Sheet
Strategies in a Highly Volatile Environment; Managing
I
\ J
.
.
J


