ch 19 solution
advertisement
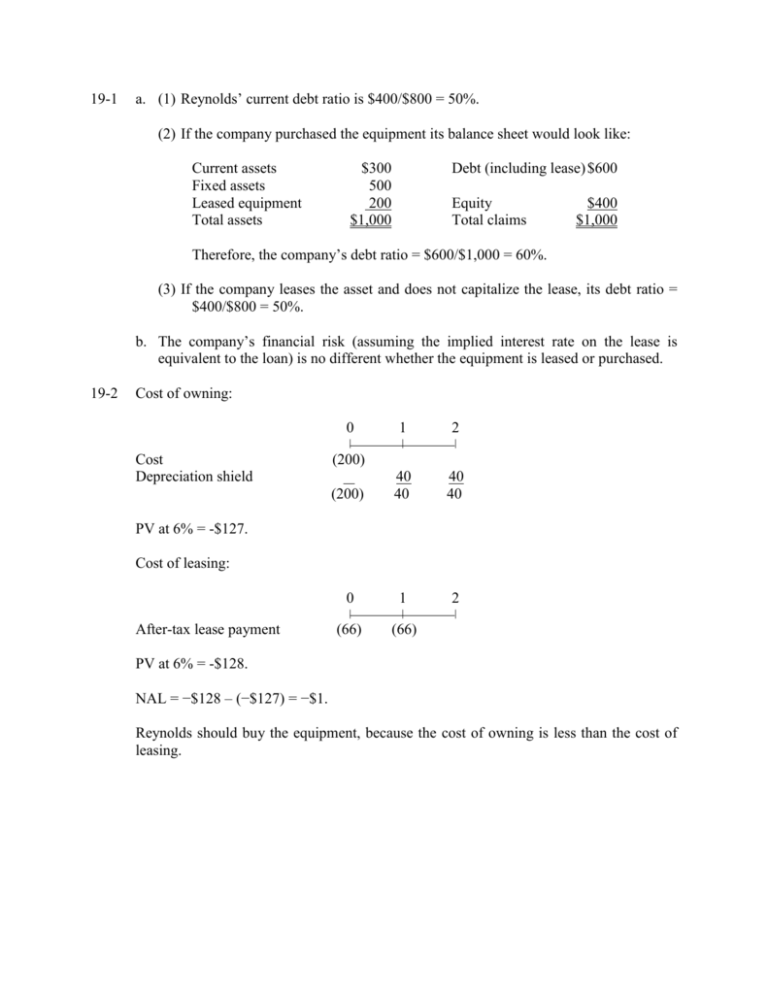
19-1 a. (1) Reynolds’ current debt ratio is $400/$800 = 50%. (2) If the company purchased the equipment its balance sheet would look like: Current assets Fixed assets Leased equipment Total assets $300 500 200 $1,000 Debt (including lease) $600 Equity Total claims $400 $1,000 Therefore, the company’s debt ratio = $600/$1,000 = 60%. (3) If the company leases the asset and does not capitalize the lease, its debt ratio = $400/$800 = 50%. b. The company’s financial risk (assuming the implied interest rate on the lease is equivalent to the loan) is no different whether the equipment is leased or purchased. 19-2 Cost of owning: Cost Depreciation shield 0 1 2 | | | (200) 40 40 40 40 0 1 2 | | | (66) (66) (200) PV at 6% = -$127. Cost of leasing: After-tax lease payment PV at 6% = -$128. NAL = −$128 – (−$127) = −$1. Reynolds should buy the equipment, because the cost of owning is less than the cost of leasing. 19-3 a. Balance sheets before lease is capitalized: Energen Balance Sheet (Owns new assets) (Thousands of Dollars) Current assets $ 25,000 Debt Fixed assets 175,000 Equity Total assets $200,000 $100,000 100,000 Total claims $200,000 Debt/assets ratio = $100/$200 = 50%. Hastings Corporation Balance Sheet (Leases as operating lease) (Thousands of Dollars) Current assets $ 25,000 Debt $ 50,000 Fixed assets 125,000 Equity 100,000 Total assets $150,000 Total claims $150,000 Debt/assets ratio = $50/$150 = 33%. b. Balance sheet after lease is capitalized: Hastings Corporation Balance Sheet (Capitalizes lease) (Thousands of Dollars) Current assets Value of leased asset $ 25,000 50,000 Fixed assets 125,000 Total assets $200,000 Debt/assets ratio = $100/$200 = 50%. 19-4 Debt PV of lease payments Equity Total claims $ 50,000 50,000 100,000 $200,000 I. Cost of Owning: 0 After-tax loan paymentsa Depr. tax savingsb Residual value Tax on residual Net cash flow 1 ($135,000) $199,980 $0 2 ($135,000) $266,700 3 ($135,000) $88,860 $131,700 ($46,140) 4 ($1,635,000) $44,460 $250,000 ($100,000) ($1,440,540) 3 (240,000) (240,000) 4 (240,000) (240,000) $4,980 PV of owning at 9% = −$885,679.47 II. Cost of Leasing: 0 Lease payment (AT) Net cash flow 1 (240,000) (240,000) $0 2 (240,000) (240,000) PV of leasing at 9% = −$777,532.77 III. Cost Comparison Net advantage to leasing (NAL)= PV of leasing - PV of owning = −$777,532.77 – (−$885,679.47) = $108,146.69. a After-tax interest payments = (0.15)($1,500,000)(1-0.40) = $135,000. Depreciation tax savings, base on MACRS 3-year life and $1,500,000 cost of new machinery:. b Year 1 2 3 4 19-5 MACRS Allowance Factor 0.3333 0.4445 0.1481 0.0741 Deprec. Tax Savings Depreciation T (Depreciation) $499,950 $199,980 666,750 266,700 222,150 88,860 111,150 44,460 Since the cost of leasing the machinery is less than the cost of owning it, Big Sky Mining should lease the equipment. a. Borrow and buy analysis: Depreciation Schedule of New Equipment Year Depreciation rates for new purchase 0 1 2 3 4 33.33% 44.45% 14.81% 7.41% Depreciation 333,300 444,500 148,100 74,100 Book Value 666,700 222,200 74,100 - 5 6 Amortization Schedule of Loan Year 0 1 2 3 4 5 6 Loan payment 257,157.5 257,157.5 257,157.5 257,157.5 257,157.5 257,157.5 Interest 140,000.0 123,598.0 104,899.6 83,583.5 59,283.2 31,580.7 Principal 117,157.5 133,559.5 152,257.9 173,574.0 197,874.3 225,576.8 1,000,000 882,842.5 749,283.0 597,025.1 423,451.1 225,576.8 0.0 0 1 -257,157.5 47,600.0 2 -257,157.5 42,023.3 3 -257,157.5 35,665.9 4 -257,157.5 28,418.4 5 -257,157.5 20,156.3 6 -257,157.5 10,737.5 113,322.0 151,130.0 50,354.0 25,194.0 0.0 0.0 -96,235.5 -64,004.2 -171,137.6 -203,545.1 -237,001.2 -246,420.0 Ending Loan Balance Cost of Owning Year Loan payments Interest tax savings Depreciation Tax savings Purchase of equipment Loan proceeds Net cash flow PV @ after-tax cost of debt -1,000,000 1,000,000 0.00 -713,300 Depreciation Schedule of Used Equipment Year Depreciation Schedule for used purchase Depreciation Book Value 0 1 2 3 4 5 6 200,000 33.33% 66,660 133,340 44.45% 88,900 44,440 14.81% 29,620 14,820 7.41% 14,820 0 Cost of Leasing Year After-tax lease payment Market value of machine Depreciation tax savings Net cash flow PV @ after-tax cost of debt Net advantage to leasing 0 0.00 1 -184,800.0 -184,800.0 2 -184,800.0 -184,800.0 3 -184,800.0 -200,000.0 -22,664.4 -407,464.4 4 5 6 -30,226.0 -30,226.0 -10,070.8 -10,070.8 -5,038.8 -5,038.8 -667,261 46,039 Net advantage to leasing = −667,261 – (−713,300) = 46,039. Because the NAL is positive, the company should choose the lease. Note that the maintenance expense is excluded from the analysis since the firm will have to bear the cost whether it buys or leases the machinery.
