1995
4.
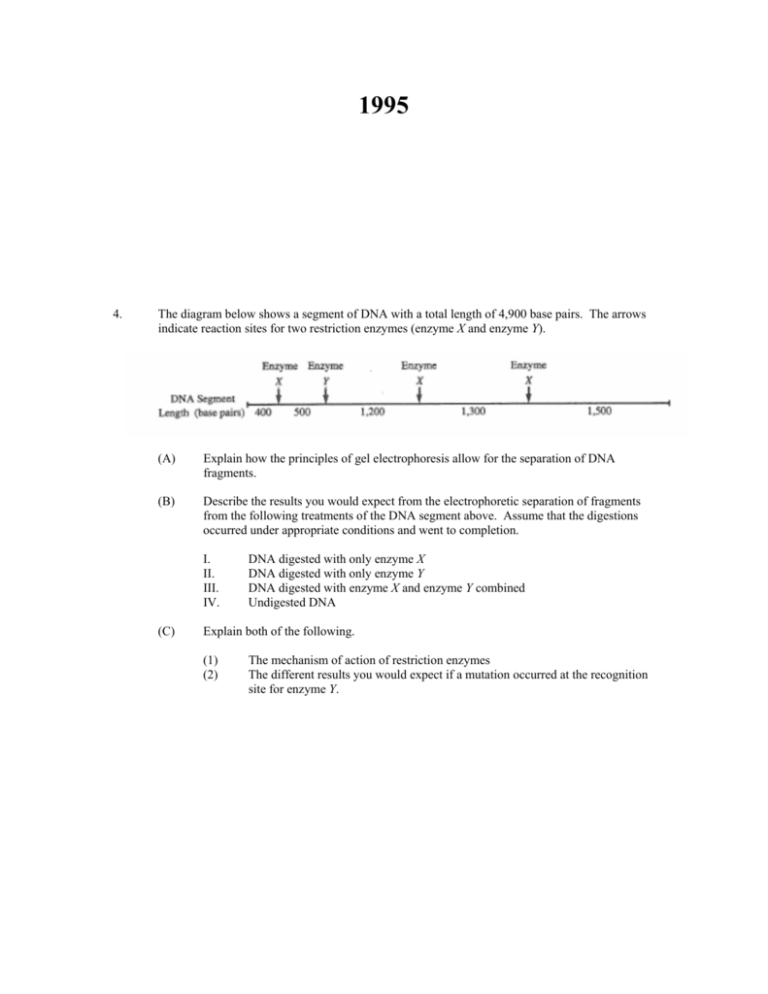
The diagram below shows a segment of DNA with a total length of 4,900 base pairs. The arrows
indicate reaction sites for two restriction enzymes (enzyme X and enzyme Y).
(A)
Explain how the principles of gel electrophoresis allow for the separation of DNA
fragments.
(B)
Describe the results you would expect from the electrophoretic separation of fragments
from the following treatments of the DNA segment above. Assume that the digestions
occurred under appropriate conditions and went to completion.
I.
II.
III.
IV.
(C)
DNA digested with only enzyme X
DNA digested with only enzyme Y
DNA digested with enzyme X and enzyme Y combined
Undigested DNA
Explain both of the following.
(1)
(2)
The mechanism of action of restriction enzymes
The different results you would expect if a mutation occurred at the recognition
site for enzyme Y.
END OF EXAMINATION
Copyright © 1970 to 2004 by College Entrance Examination Board, Princeton, NJ. All rights reserved. For face-to-face teaching
purposes, classroom teachers are permitted to reproduce the questions. Web or Mass distribution prohibited.
DNA QUESTION 1985:
L. PETERSON/AP BIOLOGY
Describe the operon hypothesis and discuss how it explains the control of
messenger RNA production and the regulation of protein synthesis in
bacterial cells.
STANDARDS:
BACKGROUND:
Max. = 2 points
__ Definition of operon (functionally related genes whose expression is controlled)
__ DNA consists of genes coding for both structural and regulating proteins
(Hypothesis)
__ Authors of Hypothesis
DESCRIPTION OF OPERON (likely the Lac Operon): Max. = 8 points
Structure (diagram)
__ promoter site
__ repressor site
__ operator site
__ structural genes
__ inducer
Max. 4
Function
Max. 4
__ binds RNA polymerase* at 3' site on DNA (* also cAMP-CAP)
__ produces repressor protein: stops RNA polymerase attaching to promoter
__ site of attachment of repressor protein
__ codes for sequential protein
__ serves to inactivate repressor
CONTROL OF mRNA PRODUCTION & CONSEQUENCES re PROTEIN SYNTHESIS: Max. = 5
__ Inducible model: derepression (lactose example) [gene always off] = 3 points
__ Repressible model: corepression (tryptophan-histidine) [gene always on] = 3 points
__ CAP model: catabolite induction: with decrease in glucose -> increase in cAMP cAMP-CAP binds to
promoter site therefore, transcription -> lactose metabolism = 3 points (above require explanation &
example)
__ Adaptive significance = 2 points
__ Final fate of mRNA transcribed = 2 points

