Fruit and Vegetable Processing
advertisement
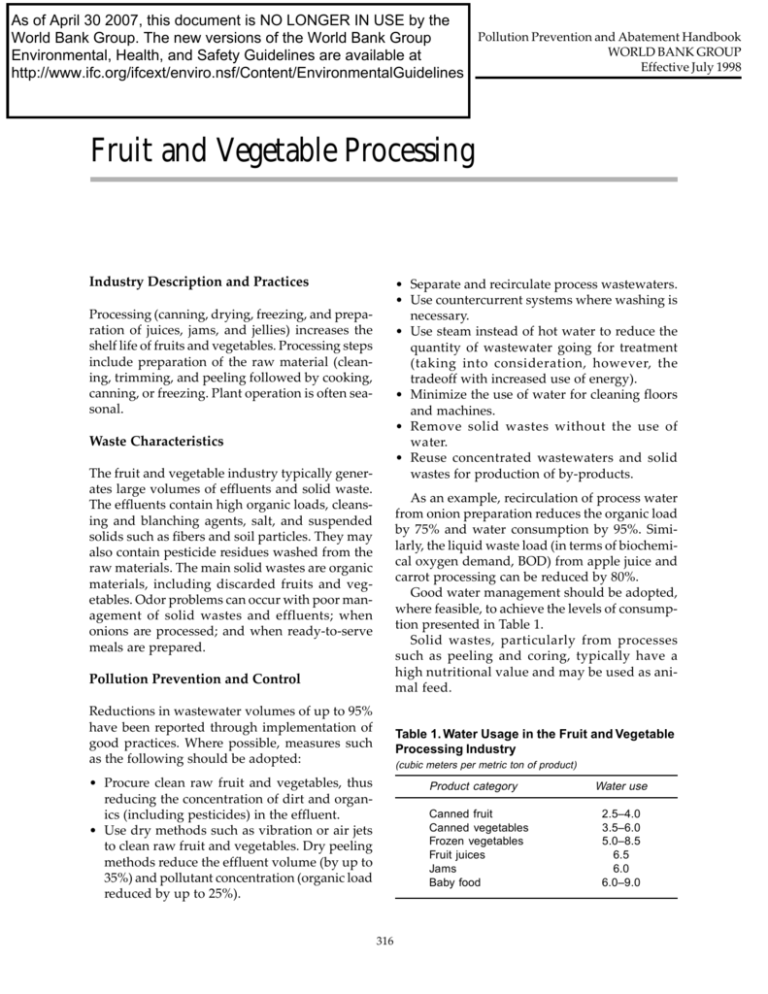
As of April 30 2007, this document is NO LONGER IN USE by the Pollution Prevention and Abatement Handbook World Bank Group. The new versions of the World Bank Group WORLD BANK GROUP Environmental, Health, and Safety Guidelines are available at Effective July 1998 http://www.ifc.org/ifcext/enviro.nsf/Content/EnvironmentalGuidelines Fruit and Vegetable Processing Industry Description and Practices • Separate and recirculate process wastewaters. • Use countercurrent systems where washing is Processing (canning, drying, freezing, and preparation of juices, jams, and jellies) increases the shelf life of fruits and vegetables. Processing steps include preparation of the raw material (cleaning, trimming, and peeling followed by cooking, canning, or freezing. Plant operation is often seasonal. necessary. • Use steam instead of hot water to reduce the quantity of wastewater going for treatment (taking into consideration, however, the tradeoff with increased use of energy). • Minimize the use of water for cleaning floors and machines. • Remove solid wastes without the use of water. • Reuse concentrated wastewaters and solid wastes for production of by-products. Waste Characteristics The fruit and vegetable industry typically generates large volumes of effluents and solid waste. The effluents contain high organic loads, cleansing and blanching agents, salt, and suspended solids such as fibers and soil particles. They may also contain pesticide residues washed from the raw materials. The main solid wastes are organic materials, including discarded fruits and vegetables. Odor problems can occur with poor management of solid wastes and effluents; when onions are processed; and when ready-to-serve meals are prepared. As an example, recirculation of process water from onion preparation reduces the organic load by 75% and water consumption by 95%. Similarly, the liquid waste load (in terms of biochemical oxygen demand, BOD) from apple juice and carrot processing can be reduced by 80%. Good water management should be adopted, where feasible, to achieve the levels of consumption presented in Table 1. Solid wastes, particularly from processes such as peeling and coring, typically have a high nutritional value and may be used as animal feed. Pollution Prevention and Control Reductions in wastewater volumes of up to 95% have been reported through implementation of good practices. Where possible, measures such as the following should be adopted: Table 1. Water Usage in the Fruit and Vegetable Processing Industry (cubic meters per metric ton of product) • Procure clean raw fruit and vegetables, thus Product category reducing the concentration of dirt and organics (including pesticides) in the effluent. • Use dry methods such as vibration or air jets to clean raw fruit and vegetables. Dry peeling methods reduce the effluent volume (by up to 35%) and pollutant concentration (organic load reduced by up to 25%). Canned fruit Canned vegetables Frozen vegetables Fruit juices Jams Baby food 316 Water use 2.5–4.0 3.5–6.0 5.0–8.5 6.5 6.0 6.0–9.0 Fruit and Vegetable Processing Target Pollution Loads Implementation of cleaner production processes and pollution prevention measures can yield both economic and environmental benefits. The target loads per unit of production shown in Table 2 can be achieved by implementing measures such as those described above. The numbers are the waste loads arising from the production processes before the addition of pollution control measures. These levels are derived from the average loads recorded in a major study of the industry and should be used as maximum levels of unit pollution in the design of new plants. Treatment Technologies Preliminary treatment of wastewaters should include screening (or sieving to recover pulp) and grit removal, if necessary. This is followed by pH adjustment and biological treatment of the organic load. The flows are frequently seasonal, and robust treatment systems are preferred for onsite treatment. Pond systems are used successfully to treat fruit and vegetable wastes, but odor nuisance, soil deterioration, and groundwater pollution are to be avoided. The quality of the effluent is normally suitable for discharge to municipal systems, although peak hydraulic loads may cause a problem. Odor problems can be avoided by using gas scrubbers or biofilters. Emissions Guidelines Emissions levels for the design and operation of each project must be established through the environmental assessment (EA) process on the basis of country legislation and the Pollution Prevention and Abatement Handbook, as applied to local conditions. The emissions levels selected must be justified in the EA and acceptable to the World Bank Group. The guidelines given below present emissions levels normally acceptable to the World Bank Group in making decisions regarding provision of World Bank Group assistance. Any deviations from these levels must be described in the World Bank Group project documentation. The emissions levels given here can be consistently 317 achieved by well-designed, well-operated, and well-maintained pollution control systems. The guidelines are expressed as concentrations to facilitate monitoring. Dilution of air emissions or effluents to achieve these guidelines is unacceptable. All of the maximum levels should be achieved for at least 95% of the time that the plant or unit is operating, to be calculated as a proportion of annual operating hours. Liquid Effluents The effluent levels presented in Table 3 should be achieved. Pesticides may be present in significant levels; testing should therefore be performed, and, if pesticides are present at levels above 0.05 milligrams per liter (mg/l), corrective action should be taken. The best course may be to switch to a supplier that provides raw materials without pesticide residues. Solid Wastes Whenever possible, organic wastes should be used in the production of animal feed or organic fertilizers. Other solid wastes should be disposed of in a secure landfill to avoid contamination of surface and groundwater. Ambient Noise Noise abatement measures should achieve either the levels given below or a maximum increase in background levels of 3 decibels (measured on the A scale) [dB(A)]. Measurements are to be taken at noise receptors located outside the project property boundary. Receptor Residential, institutional, educational Industrial, commercial Maximum allowable log equivalent (hourly measurements), in dB(A) Day Night (07:00–22:00) (22:00–07:00) 55 45 70 70 Table 2. Target Loads per Unit of Production, Fruit and Vegetable Processing Industry Fruit Product 318 Apricots Apples All products All except juice Juice Cranberries Citrus Sweet cherries Sour cherries Bing cherries Cranberries Dried fruit Grapefruit Canned Pressed Olives Peaches Canned Frozen Pears Pickles Fresh packed Process packed Salting stations Pineapples Plums Raisins Strawberries Tomatoes Peeled Products Vegetables Waste volume (m3/U) BOD5 (kg/U) TSS (kg/U) 29.0 15.0 4.3 Solid waste (kg/t product) Product Waste vol. (m3/U) BOD5 (kg/U) TSS (kg/U) All vegetables Solid waste (kg/t prod) 130 90 3.7 5.4 2.9 5.8 10.0 7.8 12.0 20.0 12.0 13.0 5.0 6.4 2.0 2.8 3.2 9.6 17.0 22.0 10.0 12.0 0.5 0.8 0.3 0.6 1.3 0.6 1.0 1.4 1.4 1.9 72.0 1.6 38.0 11.0 1.9 44.0 1.2 0.4 7.5 13.0 5.4 12.0 14.0 12.0 21.0 2.3 1.8 3.2 8.5 9.6 1.1 13.0 5.0 2.8 13.0 9.5 18.0 8.0 10.0 4.1 6.0 5.3 1.9 3.3 0.4 2.7 0.3 1.6 1.4 8.9 4.7 4.1 1.3 6.1 2.7 n.a. Not applicable. Source: Adapted from Economopoulos 1993. 10 20 180 200 60 Asparagus Beets Broccoli Brussels sprouts Carrots Cauliflower Corn Canned Frozen Dehydrated onion and garlic Dehydrated vegetables Dry beans Lima beans Mushrooms Onions, canned Peas Canned Frozen Pimentos Potatoes All products Frozen products Dehydrated products Sauerkraut Canned Cut Snap beans Canned Frozen Spinach Canned Frozen Squash Sweet potatoes 69.0 5.0 11.0 36.0 12.0 89.0 2.1 20.0 9.8 3.4 20.0 5.2 3.4 3.9 5.6 11.0 12.0 2.7 4.5 13.0 14.0 20.0 6.7 5.6 20.0 6.5 5.9 22.0 18.0 27.0 22.0 23.0 7.9 15.0 14.0 8.7 23.0 5.6 4.4 10.0 4.8 9.3 20.0 15.0 29.0 22.0 18.0 27.0 5.4 4.9 2.9 10.0 11.0 8.8 18.0 23.0 11.0 16.0 19.0 8.6 3.5 0.4 3.5 1.2 0.6 0.2 15.0 20.0 3.1 6.0 2.0 3.0 38.0 29.0 5.6 4.1 8.2 4.8 17.0 30.0 6.5 2.0 2.3 12.0 200 200 40 40 40 Fruit and Vegetable Processing Table 3. Effluents from the Fruit and Vegetable Processing Industry (milligrams per liter, except for pH) Parameter Maximum value pH BOD COD TSS Oil and grease Total nitrogen Total phosphorus 6–9 50 250 50 10 10 5 Note: Effluent requirements are for direct discharge to surface waters. 319 corrective actions can be taken. Records of monitoring results should be kept in an acceptable format. The results should be reported to the responsible authorities and relevant parties, as required. Key Issues The key production and control practices that will lead to compliance with emissions guidelines can be summarized as follows: • Implement water conservation and recycling measures. • Adopt dry cleaning and peeling methods. Monitoring and Reporting Monitoring of the final effluent for the parameters listed in this document should be carried out at least once per month—more frequently, if the flows vary substantially. To estimate water usage in various production processes, the wastewaters from unit operations should be monitored during each product season or, at a minimum, annually. Monitoring data should be analyzed and reviewed at regular intervals and compared with the operating standards so that any necessary Sources Economopoulos, Alexander P. 1993. Assessment of Sources of Air, Water, and Land Pollution: A Guide to Rapid Source Inventory Techniques and their Use in Formulating Environmental Control Strategies. Part 1: Rapid Inventory Techniques in Environmental Pollution. Geneva: World Health Organization. World Bank. 1996. “Pollution Prevention and Abatement: Fruit and Vegetable Processing.” Draft Technical Background Document. Environment Department, Washington, D.C.
