Statistical Analysis of Off-Off-Broadway Budgets
advertisement
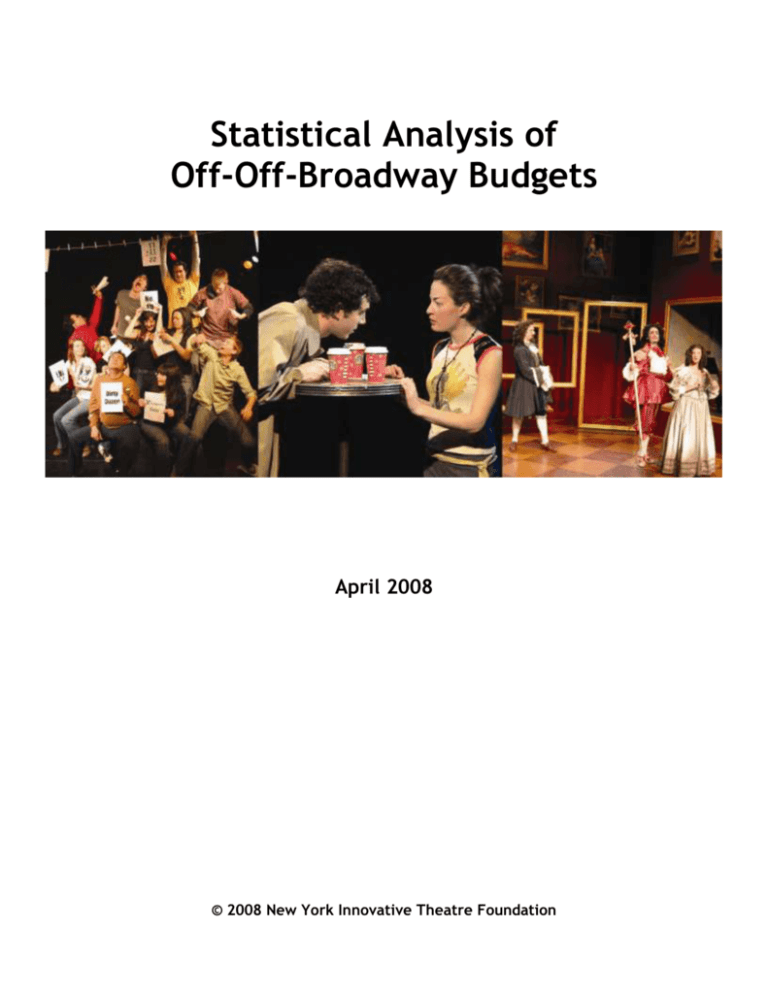
Statistical Analysis of Off-Off-Broadway Budgets April 2008 © 2008 New York Innovative Theatre Foundation ABOUT THIS STUDY While the Off-Off-Broadway (OOB) community encompasses hundreds of companies and thousands of theatre artists, there exists virtually no statistical information about this vast and diverse community. In an endeavor to create a baseline for this important information, we are conducting a series of survey programs. The subject of the first completed study is production budgets and how Off-Off-Broadway producers spend their money. THIS IS NOT AN ECONOMIC IMPACT STUDY. This is an analysis of production budgets only. This survey was conducted by the New York Innovative Theatre Foundation, producer of the New York Innovative Theatre Awards (IT Awards). Online survey forms were made available on the IT Awards website (www.nyitawards.com) from May 1, 2007 - February 1, 2008. Notification and invitations to participate in this survey were sent via direct email to all Off-Off-Broadway theatre companies listed in the IT Awards database, which includes approximately 350 companies. It is important to note that this database includes theatre companies that are registered with the IT Awards as well as those that are not. In addition, prompts to take the survey were included in the monthly IT Awards Update from May 2007 - December 2007. The Update is an opt-in newsletter which is sent to approximately 6,500 people each month. Word of mouth also played a key role in encouraging participation. It was required that respondents provide answers to all of the questions in order to complete the survey. Only completed surveys were recorded for this study. With a guarantee of anonymity, respondents were asked to provide the name of the theatre company they represented for verification purposes. Seventy-three (73) Off-Off-Broadway theatre companies completed the survey, which represents approximately a 20% response rate. Questions for this survey focused exclusively on production budgets and did not include general operating expenses. The approximate number of OOB productions per year was derived from the careful monitoring of OOB show listings on theatremania.com, offoffonline.com, nytheatre.com, unitedstages.com and nyitawards.com for the 2006-2007 season. We recorded approximately 1,700 unique Off-OffBroadway listings for the year. Numbers were rounded off to the nearest ten dollars or percentage point. Survey Program This is the first of several surveys to be conducted by the New York Innovative Theatre Foundation in an effort to establish a baseline of statistical information for the Off-Off-Broadway community. An ongoing demographic survey of OOB participants can be completed by members of the Off-OffBroadway community by going to www.nyitawards.com/survey. Plans for broader and more in-depth surveys such as an audience demographic survey and an economic impact survey are currently in development. These future studies may be conducted in partnership with other respected New York theatre community organizations. 2 GENERAL OVERVIEW OF SAMPLE There is great variation from one Off-Off-Broadway theatre company to the next. Within the sample there are companies that have been in existence for more than 40 years while others have been producing for as little as 14 months (chart 1). Most of the respondents present 1 or 2 productions per year, with 5% managing over 10 productions in a season (chart 2). The majority of the companies rent their performance spaces and vary locations from project to project (chart 5). Over half of the companies present new/original works, while a third present established works (chart 6). Chart 1 Years producing Off-Off-Broadway theatre 40% 35% 30% 37% 32% 25% 20% 15% 16% 10% 5% 7% 0% 1 - 3 years 4 - 7 years 8% 8 - 10 years 11 - 20 years over 20 years Based on the sample group, the average OOB theatre company has been producing for 7 years. Chart 2 Number of productions per year 35% 30% 33% 29% 25% 20% 23% 15% 10% 10% 5% 0% 1 production 2 productions 3-5 productions 6 - 10 productions 5% over 10 productions Based on the sample group, OOB theatre companies present an average of 3 productions a year. 3 Chart 3 Number of performances per production 50% 45% 40% 35% 30% 25% 20% 15% 10% 5% 0% 44% 41% 13% 1 - 12 performances 13 - 16 performances 6% 17 - 24 performances over 24 performances Based on the sample group, OOB productions have an average of 14 performances. NOTE: 2 companies from the sample group present serial productions of 1 performance each. They were excluded from the findings of this table. Chart 4 Union/Non-Union productions Chart 5 Performance space use 70% 90% 80% 60% 50% 70% 61% 84% 60% 50% 40% 40% 39% 30% 30% 20% 20% 10% 10% 11% 0% 0% Rent various locations Equity Non-Equity Chart 6 Source of script/work 60% 50% 56% 40% 30% 33% 20% 10% 11% 0% New works Established works Combination 4 Manage or are in residence 5% Own their space KEY FINDINGS Production Budget The average total production budget for an Off-Off-Broadway show is approximately $18,000. This represents actual money spent on a single production. While there are often services or products donated to the production, the dollar amounts presented in this study do not include the value of these in-kind services or donations, which could significantly increase the numbers shown here. Chart 7 Overall Production Budget 25% 20% 22% 19% 15% 15% 10% 12% 11% 5% 8% 8% 4% ov er $5 0, 00 0 00 0 -$ 50 , 00 0 $3 5, 00 0 -$ 35 , 00 0 $2 5, 00 0 -$ 25 , 00 0 $2 0, 00 0 -$ 20 , 00 0 $1 5, 00 0 -$ 15 , 10 ,0 00 $1 0, 00 0 -$ $5 ,0 00 $1 -$ 5, 00 0 0% Performance Space Rental An average of 36% of the overall production budget is spent on performance space rental. The average cost of a space for a 4-week run is $6,600, which averages $1,650 per week and $470 per performance (based on a schedule of 14 performances). Three different respondents reported that the rent for their most recent production was $4,000 per week. This was the highest weekly rent reported. The lowest was $120 per week. NOTE: The 4 companies from the sample group that own their space were excluded from these space cost statistics. 5 Production Expenditures There are an endless number of possible variables that can go into a production budget. For the purposes of this study, production costs were narrowed down to the following key expenditures: Table 1 Construction Materials Average Percentage of budget $1,320 7% Lights $500 3% Costumes (includes hair and make-up) $710 4% Sound $220 1% Props $180 1% Sets Table 2 Publicity/Marketing Average Percentage of budget $790 4% $1,790 7% Printing (postcards, posters, brochures, etc.) $740 4% Advertising (print ads, online ads, etc.) $710 4% Publicist (includes all respondents) Publicist (excludes respondents that did not use a publicist) 58% of the respondents use a publicist while 42% do not. Table 3 Other Costs Average Percentage of budget Insurance $430 2% Transportation $800 4% $1,860 11% Misc./Other 6 Artists Fees The artist fees below represent payment for services rendered only and do not include reimbursement for transportation, supplies or materials. The amounts are for the entire run of the production. Table 4 Actor Fees Average Percentage of budget $1,330 7% Actor fees (includes all respondents) Full Cast Per Actor (based on average of 5 actors per production) $270 Actor fees (excludes respondents that did not pay actors) Full Cast $2,110 Per Actor (based on average of 5 actors per production) 9% $420 62% of the respondents pay the actors while 38% do not. Table 5 Average Percentage of budget All Designers $800 4% Per Designer (based on average of 4 designers per production) $200 Designer Fees Designer fees (includes all respondents) Designer fees (excludes respondents that did not pay designers) All Designers $1,350 Per Designer (based on average of 4 designers per production) 6% $340 63% of the respondents pay the designers while 37% do not. Table 6 Average Percentage of budget Stage Manager/Crew $300 2% Director $500 3% Playwright $460 3% Director, Stage Manager, Playwright Fees 48% of the respondents pay the playwrights (pay royalties) while 52% do not. 7 EXTRAPOLATED DATA Using the averages above and applying them to the estimated number of Off-Off-Broadway productions per year, the following average annual production spending for Off-OffBroadway can be extrapolated: Table 7 Annual Production Budget Expenditure by OOB Community Average spent annually by OOB Productions Expenditure Space Rental $11,220,000.00 Sets $ 2,244,000.00 Lights $ Costumes $ 1,139,000.00 Make-up $ 68,000.00 Sound $ 374,000.00 Props $ 306,000.00 Publicist $ 1,343,000.00 Printing $ 1,258,000.00 Advertising $ 1,207,000.00 Insurance $ Transportation $ 1,360,000.00 Actor Fees $ 2,261,000.00 Designer Fees $ 1,360,000.00 Stage Manager Fees $ 510,000.00 Director Fees $ 850,000.00 Playwright Fees $ 782,000.00 Misc./Other $ 3,162,000.00 Total production expenditure 850,000.00 731,000.00 $31,025,000.00 Based on the findings, it is estimated that the Off-Off-Broadway community, as a whole, spends over $31 million dollars per year on productions. NOTE: It is important to note that this is not an economic impact study and in no way accounts for the full economic impact of OOB. 8 ABOUT THE NEW YORK INNOVATIVE THEATRE FOUNDATION The New York Innovative Theatre Foundation brings recognition to the great work being done in New York City's Off-Off-Broadway, honors its artistic heritage, and provides a meeting ground for this extensive and richly varied community. The organization advocates for Off-Off-Broadway and recognizes the unique and essential role it plays in contributing to American and global culture. We believe that publicly recognizing excellence in Off-Off-Broadway will expand audience awareness and fosters greater appreciation of the full New York theatre experience. The IT Awards is a not-for-profit arts organization supporting the OffOff-Broadway community by: Celebrating and Recognizing extraordinary Off-Off-Broadway Theatre Strengthening and nurturing the Off-Off-Broadway community Advocating for the Off-Off-Broadway community Honoring our artistic heritage Advancing public interest in and understanding of the theatrical arts www.nyitawards.com 212-465-3347 Photos from the cover are from (L to R): The New York Neo-Futurists' production of Too Much Light Makes the Baby Go Blind; Rising Sun Performance Company's production of The Shape of Things - photo by David Anthony; and HoNkBarK! and Vital Theatre's production of the Country Wife - photo by Sergio Reynoso. © 2008 New York Innovative Theatre Foundation 9
