High-Resolution Cortical Imaging
advertisement
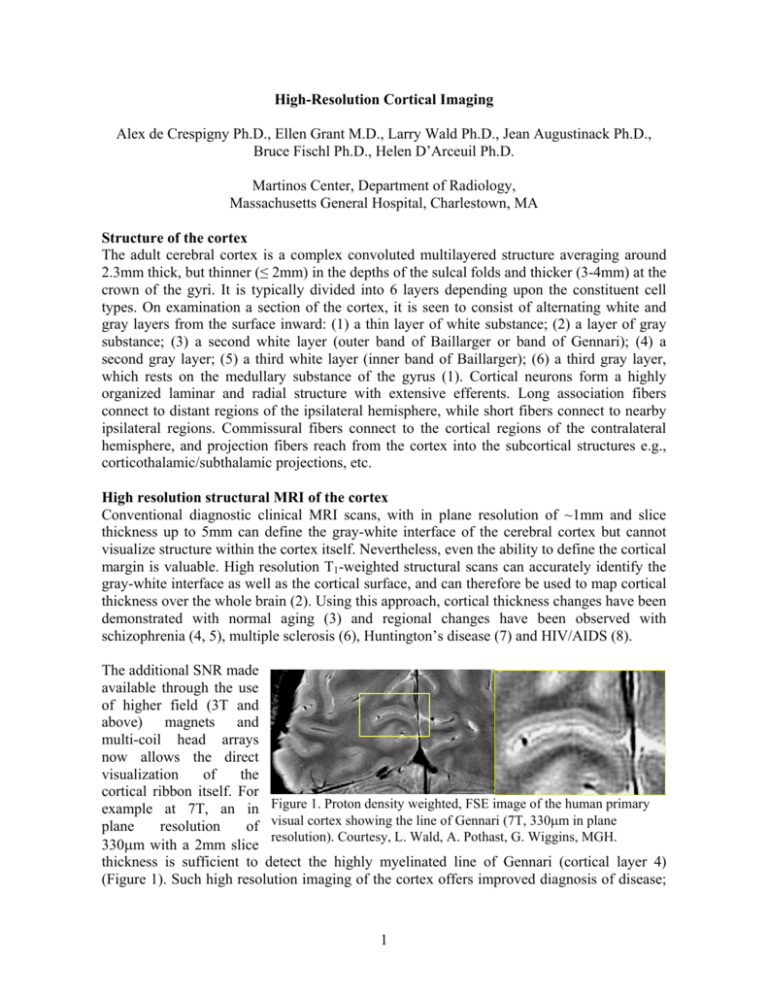
High-Resolution Cortical Imaging Alex de Crespigny Ph.D., Ellen Grant M.D., Larry Wald Ph.D., Jean Augustinack Ph.D., Bruce Fischl Ph.D., Helen D’Arceuil Ph.D. Martinos Center, Department of Radiology, Massachusetts General Hospital, Charlestown, MA Structure of the cortex The adult cerebral cortex is a complex convoluted multilayered structure averaging around 2.3mm thick, but thinner (≤ 2mm) in the depths of the sulcal folds and thicker (3-4mm) at the crown of the gyri. It is typically divided into 6 layers depending upon the constituent cell types. On examination a section of the cortex, it is seen to consist of alternating white and gray layers from the surface inward: (1) a thin layer of white substance; (2) a layer of gray substance; (3) a second white layer (outer band of Baillarger or band of Gennari); (4) a second gray layer; (5) a third white layer (inner band of Baillarger); (6) a third gray layer, which rests on the medullary substance of the gyrus (1). Cortical neurons form a highly organized laminar and radial structure with extensive efferents. Long association fibers connect to distant regions of the ipsilateral hemisphere, while short fibers connect to nearby ipsilateral regions. Commissural fibers connect to the cortical regions of the contralateral hemisphere, and projection fibers reach from the cortex into the subcortical structures e.g., corticothalamic/subthalamic projections, etc. High resolution structural MRI of the cortex Conventional diagnostic clinical MRI scans, with in plane resolution of ~1mm and slice thickness up to 5mm can define the gray-white interface of the cerebral cortex but cannot visualize structure within the cortex itself. Nevertheless, even the ability to define the cortical margin is valuable. High resolution T1-weighted structural scans can accurately identify the gray-white interface as well as the cortical surface, and can therefore be used to map cortical thickness over the whole brain (2). Using this approach, cortical thickness changes have been demonstrated with normal aging (3) and regional changes have been observed with schizophrenia (4, 5), multiple sclerosis (6), Huntington’s disease (7) and HIV/AIDS (8). The additional SNR made available through the use of higher field (3T and above) magnets and multi-coil head arrays now allows the direct visualization of the cortical ribbon itself. For example at 7T, an in Figure 1. Proton density weighted, FSE image of the human primary plane resolution of visual cortex showing the line of Gennari (7T, 330μm in plane resolution). Courtesy, L. Wald, A. Pothast, G. Wiggins, MGH. 330μm with a 2mm slice thickness is sufficient to detect the highly myelinated line of Gennari (cortical layer 4) (Figure 1). Such high resolution imaging of the cortex offers improved diagnosis of disease; 1 for example, the detection of subtle cortical neoplasms (not seen on conventional clinical scans) can identify an epileptogenic focus on patients who might not otherwise have an indication for epilepsy surgery. Diffusion tensor imaging of the cortex DTI tractography studies have sought to characterize the connections between cortical regions (9, 10). Typically DTI tract tracing algorithms halt when the diffusion anisotropy index FA falls below a threshold value (~0.2) and thus fall short of penetrating into the cortex itself. It is well known that there is a significant orientational dependence of diffusion of water within the cerebral cortex in the Figure 2. DTI at 2mm isotropic resolution at 3T. FA map with early developing brain. This cortical anisotropy, which is tensors superimposed. (courtesy, D. Tuch, J Wisco, MGH). mainly in a radial direction (i.e. perpendicular to the cortical surface), was observed in animal MRI studies (11). Serial DTI measurements in animals have shown a rapidly decreasing FA in the cortex as a function of increasing age (12-14). In extremely premature infants the cortical plate is largely unconvoluted and shows significant diffusion anisotropy (15). After birth, radial diffusion anisotropy is present in the human neonatal cortex which decreases with age as the cortex develops and the sulci become more pronounced (16) and is not typically seen at all in adults. Imaging the cortex with DTI in adult human presents a particular challenge because the thin cortical sheet is highly convoluted, and diffusion weighted images of this structure are often plagued by inadequate resolution, partial volume averaging with CSF (serving to reduce the apparent anisotropy (17)) and eddy current effects.. Even at a relatively high resolution (for DTI) of 2mm isotropic voxel size in the human brain, it is difficult to find pixels that contain only cortical gray matter (Fig. 2). As a result, the familiar FA map of an adult brain shows most of the cerebral cortex as dark and generally uninformative. Nevertheless there is some evidence that gray matter FA measured by conventional DTI may be sensitive to pathology such as stroke (18, 19) although the mechanisms are not yet clear. High b-value DTI acquisitions in adult cat brain have indicated the presence of radial fiber structure in the cortex (20). Using a multi-channel head coil (e.g. 22+ coils), it is possibly to acquire higher resolution DTI with a 1mm voxel size which begins to visualize the cortical strip and shows evidence of the radial orientational structure in gray matter. However this is still insufficient spatial resolution to see detail such as the layering with the gray matter itself. Imaging studies of fixed cortical samples While advances in human MRI hardware continue to improve spatial resolution in the brain in vivo, there are some compelling reasons to carry out studies of fixed brain tissues; the most obvious being that the stability of such samples allows for extended scanning in high field magnets to achieve much greater spatial resolution than is currently possible in vivo. Noninvasive ‘histology’ using MRI and MR microscopy is an established methodology (21, 2 22). It can provide a way to relate macrostructure (seen on in vivo scans) to microstructure (seen on conventional histology), as well as to establish the spatial resolution needed to visualize various structures (e.g. cortical layering), as well as providing morphological phenotyping in model systems (23). The protein cross linking that occurs upon tissue fixation significantly reduces both T1 and T2 (24, 25) and has the effect of flattening image contrast in the brain. However proton density contrast is maintained and even increases slightly upon tissue fixation (26). Therefore, a mixed contrast imaging protocol has proved useful for delineating cortical layering structure (27) and entorhinal islands in the hippocampal cortex (28). In addition to proton density contrast, T2* provides excellent tissue contrast at high field, Figure 3. Both contrast mechanisms Figure 3: PD/T2* weighted image of the V1/V2 seem to be related to differences in the boundary in human visual cortex (7T, 160μm isotissue myelination and correspond well to tropic resolution, TE 46.5ms). contrast seen on Nissl stains (28). DTI studies of fixed brain tissue indicate that while the trace ADC values are significantly reduced, the diffusion anisotropy is well preserved (12, 29). This is true of both FA from DTI scans and also higher order orientational structure (e.g. from DSI scans (30)) (31). High resolution DTI scans of human cortical samples show laminar structure and tractography results show white matter fibers inserting into the cortical gray matter, and also short range U-fibers connecting nearby cortical regions (32), see Figure 4. This approach shows promise for detecting changes in complex fiber ‘connectivity’ patterns in conditions such as stroke, and for characterizing developmental and other abnormalities of the cortex (33). (A) (B) (C) Figure 4: High resolution 3D DTI scans of fixed human premotor cortex (4.7T, 220μm isotropic resolution). (A) ADC (trace), (B) FA, (C) DTI tractography. 3 Summary Current clinical MRI scans do not yet typically resolve structure within the cerebral cortex, however high resolution 3D scanning allows accurate measurements of the thickness of the cortical ribbon, which may be a valuable indicator of various disease states. Very high resolution structural scans of fixed brain specimens reveals detailed structure consistent with histological sections and points the way for further developments in in vivo MRI of the cortex. DTI scans in human neonates have showed strong diffusion anisotropy in the cerebral cortex which declines rapidly with age. DTI data from animal and in vitro human experiments confirm the presence of diffusion anisotropy in adult cortex, a weaker form of that present in infant brain. Ex vivo DTI tractography shows complex structure in the cortex which is markedly perturbed in several disease states. The keys to successfully implementing such methods in the living human cortex are high spatial resolution, high SNR and high bvalues. Continued improvements in multi-coil technology, high field MRI scanners and pulse sequence design will allow us to meet this challenge. Given the tremendous yield from studies of diffusion anisotropy in cerebral white matter, there is every reason to expect that extending the methodology to cortical gray matter would be well worth the effort. Acknowledgements We are grateful for help from George Dai and Luis Concha and to funding support from NINDS:1RO1NS401285, NCRR: P41RR14075, 1S10RR016811-01, and the Mental Illness and Neuroscience Discovery (MIND) Institute. References 1. Gray H. Gray's Anatomy, 30th Edition. Lippincott Williams & Wilkins; 1985. 2. Fischl B, Dale AM. Measuring the thickness of the human cerebral cortex from magnetic resonance images. Proc Natl Acad Sci U S A 2000;97:11050-5. 3. Salat DH, Buckner RL, Snyder AZ, Greve DN, Desikan RS, Busa E, Morris JC, Dale AM, Fischl B. Thinning of the cerebral cortex in aging. Cereb Cortex 2004;14:721-30. 4. Narr KL, Bilder RM, Toga AW, Woods RP, Rex DE, Szeszko PR, Robinson D, Sevy S, GunduzBruce H, Wang YP, DeLuca H, Thompson PM. Mapping cortical thickness and gray matter concentration in first episode schizophrenia. Cereb Cortex 2005;15:708-19. 5. Kuperberg GR, Broome MR, McGuire PK, David AS, Eddy M, Ozawa F, Goff D, West WC, Williams SC, van der Kouwe AJ, Salat DH, Dale AM, Fischl B. Regionally localized thinning of the cerebral cortex in schizophrenia. Arch Gen Psychiatry 2003;60:878-88. 6. Sailer M, Fischl B, Salat D, Tempelmann C, Schonfeld MA, Busa E, Bodammer N, Heinze HJ, Dale A. Focal thinning of the cerebral cortex in multiple sclerosis. Brain 2003;126:1734-44. 7. Rosas HD, Liu AK, Hersch S, Glessner M, Ferrante RJ, Salat DH, van der Kouwe A, Jenkins BG, Dale AM, Fischl B. Regional and progressive thinning of the cortical ribbon in Huntington's disease. Neurology 2002;58:695-701. 8. Thompson PM, Dutton RA, Hayashi KM, Toga AW, Lopez OL, Aizenstein HJ, Becker JT. Thinning of the cerebral cortex visualized in HIV/AIDS reflects CD4+ T lymphocyte decline. Proc Natl Acad Sci U S A 2005;102:15647-52. 9. Mori S, Kaufmann WE, Davatzikos C, Stieltjes B, Amodei L, Fredericksen K, Pearlson GD, Melhem ER, Solaiyappan M, Raymond GV, Moser HW, van Zijl PC. Imaging cortical association tracts in the human brain using diffusion-tensor-based axonal tracking. Magn Reson Med 2002;47:215-23. 10. Lehericy S, Ducros M, Van de Moortele PF, Francois C, Thivard L, Poupon C, Swindale N, Ugurbil K, Kim DS. Diffusion tensor fiber tracking shows distinct corticostriatal circuits in humans. Ann Neurol 2004;55:522-9. 4 11. Thornton JS, Ordidge RJ, Penrice J, Cady EB, Amess PN, Punwani S, Clemence M, Wyatt JS. Anisotropic water diffusion in white and gray matter of the neonatal piglet brain before and after transient hypoxia-ischaemia. Magn Reson Imaging 1997;15:433-40. 12. Mori S, Itoh R, Zhang J, Kaufmann WE, van Zijl PC, Solaiyappan M, Yarowsky P. Diffusion tensor imaging of the developing mouse brain. Magn Reson Med 2001;46:18-23. 13. D'Arceuil H, Hotakaimen M, Liu C, Themelis G, de Crespigny A, Francheschini M. Postnatal Brain Maturation in Rabbits Studies by Combined NIRS and MRI. 12th ISMRM Meeting, Kyoto, Japan, 2004. p. 1453. 14. D'Arceuil H, Hotakaimen M, Liu C, Themelis G, de Crespigny A, Francheschini M. Nearinfrared frequency-domain optical spectrometry (NIRS) and magnetic resonance imaging (MRI): a combined approach to studying cerebral maturation in neonatal rabbits. J Biomed Optics 2005;10(1) 011011-011020. 15. Maas LC, Mukherjee P, Carballido-Gamio J, Veeraraghavan S, Miller SP, Partridge SC, Henry RG, Barkovich AJ, Vigneron DB. Early laminar organization of the human cerebrum demonstrated with diffusion tensor imaging in extremely premature infants. Neuroimage 2004;22:1134-40. 16. McKinstry RC, Mathur A, Miller JH, Ozcan A, Snyder AZ, Schefft GL, Almli CR, Shiran SI, Conturo TE, Neil JJ. Radial organization of developing preterm human cerebral cortex revealed by non-invasive water diffusion anisotropy MRI. Cereb Cortex 2002;12:1237-43. 17. Bhagat YA, Beaulieu C. Diffusion anisotropy in subcortical white matter and cortical gray matter: changes with aging and the role of CSF-suppression. J Magn Reson Imaging 2004;20:216-27. 18. Sorensen AG, Wu O, Copen WA, Davis TL, Gonzalez RG, Koroshetz WJ, Reese TG, Rosen BR, Wedeen VJ, Weisskoff RM. Human acute cerebral ischemia: detection of changes in water diffusion anisotropy by using MR imaging. Radiology 1999;212:785-92. 19. de Crespigny A, Liu Y, He J, Duggan M, Gonzalez R, D'Arceuil H, Pryor J. Acutely Elevated Diffusion Anisotropy in a Nonhuman Primate Stroke Model. 12th ISMRM Meeting, 2004. p. 1463. 20. Ronen I, Kim KH, Garwood M, Ugurbil K, Kim DS. Conventional DTI vs. slow and fast diffusion tensors in cat visual cortex. Magn Reson Med 2003;49:785-90. 21. Johnson GA, Benveniste H, Black RD, Hedlund LW, Maronpot RR, Smith BR. Histology by magnetic resonance microscopy. Magn Reson Q 1993;9:1-30. 22. Boyko OB, Alston SR, Fuller GN, Hulette CM, Johnson GA, Burger PC. Utility of postmortem magnetic resonance imaging in clinical neuropathology. Arch Pathol Lab Med 1994;118:219-25. 23. Johnson GA, Cofer GP, Fubara B, Gewalt SL, Hedlund LW, Maronpot RR. Magnetic resonance histology for morphologic phenotyping. J Magn Reson Imaging 2002;16:423-9. 24. Tovi M, Ericsson A. Measurements of T1 and T2 over time in formalin-fixed human whole-brain specimens. Acta Radiol 1992;33:400-4. 25. Pfefferbaum A, Sullivan EV, Adalsteinsson E, Garrick T, Harper C. Postmortem MR imaging of formalin-fixed human brain. Neuroimage 2004;21:1585-95. 26. Blamire AM, Rowe JG, Styles P, McDonald B. Optimising imaging parameters for post mortem MR imaging of the human brain. Acta Radiol 1999;40:593-7. 27. Fatterpekar GM, Naidich TP, Delman BN, Aguinaldo JG, Gultekin SH, Sherwood CC, Hof PR, Drayer BP, Fayad ZA. Cytoarchitecture of the human cerebral cortex: MR microscopy of excised specimens at 9.4 Tesla. AJNR Am J Neuroradiol 2002;23:1313-21. 28. Augustinack JC, van der Kouwe AJ, Blackwell ML, Salat DH, Wiggins CJ, Frosch MP, Wiggins GC, Potthast A, Wald LL, Fischl BR. Detection of entorhinal layer II using 7Tesla magnetic resonance imaging. Ann Neurol 2005;57:489-94. 29. Sun SW, Neil JJ, Song SK. Relative indices of water diffusion anisotropy are equivalent in live and formalin-fixed mouse brains. Magn Reson Med 2003;50:743-8. 5 30. Wedeen VJ, Hagmann P, Tseng WY, Reese TG, Weisskoff RM. Mapping complex tissue architecture with diffusion spectrum magnetic resonance imaging. Magn Reson Med 2005;54:1377-86. 31. de Crespigny AJ, D'Arceuil HE, Dai GG, Wang R, Kim Y, Mandeville JB, Wedeen VJ. Comparison of in vivo and ex vivo Diffusion Spectrum Imaging (DSI). 13th Annual Meeting of the International Society for Magnetic Resonance in Medicine, Miami, Florida, 2005. p. 583. 32. de Crespigny AJ. In there any value in studying diffusion anisotropy in the cerebral cortex? International Society for Magnetic Resonance in Medicine: Workshop on Methods for Quantitative Diffusion MRI of Human Brain, Lake Louise, Alberta, Canada, 2005. p. 33. D'Arceuil HE, Wang R, Dai GG, Liu Y, Kosofsky BE, Wedeen VJ, de Crespigny AJ. Neurodevelopment and Brain Pathology Depicted by Diffusion Spectrum Imaging (DSI). 13th Annual Meeting of the International Society for Magnetic Resonance in Medicine, Miami, Florida, 2005. p. 393. 6

