Ultrasound
advertisement
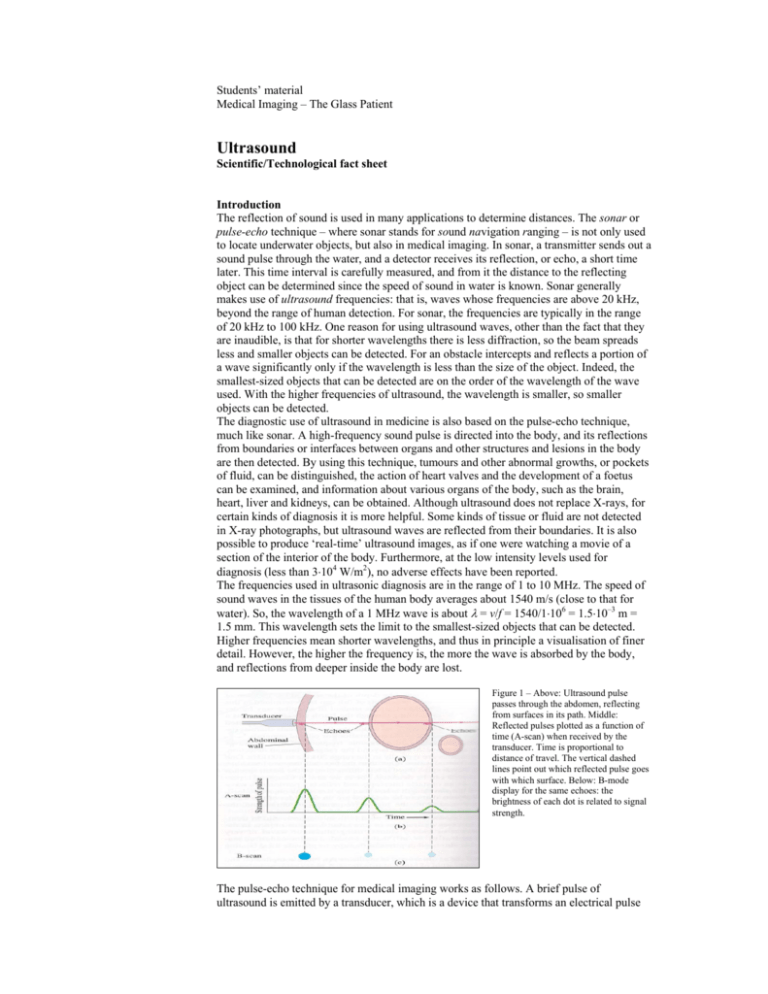
Students’ material Medical Imaging – The Glass Patient Ultrasound Scientific/Technological fact sheet Introduction The reflection of sound is used in many applications to determine distances. The sonar or pulse-echo technique – where sonar stands for sound navigation ranging – is not only used to locate underwater objects, but also in medical imaging. In sonar, a transmitter sends out a sound pulse through the water, and a detector receives its reflection, or echo, a short time later. This time interval is carefully measured, and from it the distance to the reflecting object can be determined since the speed of sound in water is known. Sonar generally makes use of ultrasound frequencies: that is, waves whose frequencies are above 20 kHz, beyond the range of human detection. For sonar, the frequencies are typically in the range of 20 kHz to 100 kHz. One reason for using ultrasound waves, other than the fact that they are inaudible, is that for shorter wavelengths there is less diffraction, so the beam spreads less and smaller objects can be detected. For an obstacle intercepts and reflects a portion of a wave significantly only if the wavelength is less than the size of the object. Indeed, the smallest-sized objects that can be detected are on the order of the wavelength of the wave used. With the higher frequencies of ultrasound, the wavelength is smaller, so smaller objects can be detected. The diagnostic use of ultrasound in medicine is also based on the pulse-echo technique, much like sonar. A high-frequency sound pulse is directed into the body, and its reflections from boundaries or interfaces between organs and other structures and lesions in the body are then detected. By using this technique, tumours and other abnormal growths, or pockets of fluid, can be distinguished, the action of heart valves and the development of a foetus can be examined, and information about various organs of the body, such as the brain, heart, liver and kidneys, can be obtained. Although ultrasound does not replace X-rays, for certain kinds of diagnosis it is more helpful. Some kinds of tissue or fluid are not detected in X-ray photographs, but ultrasound waves are reflected from their boundaries. It is also possible to produce ‘real-time’ ultrasound images, as if one were watching a movie of a section of the interior of the body. Furthermore, at the low intensity levels used for diagnosis (less than 3⋅104 W/m2), no adverse effects have been reported. The frequencies used in ultrasonic diagnosis are in the range of 1 to 10 MHz. The speed of sound waves in the tissues of the human body averages about 1540 m/s (close to that for water). So, the wavelength of a 1 MHz wave is about λ = v/f = 1540/1⋅106 = 1.5⋅10–3 m = 1.5 mm. This wavelength sets the limit to the smallest-sized objects that can be detected. Higher frequencies mean shorter wavelengths, and thus in principle a visualisation of finer detail. However, the higher the frequency is, the more the wave is absorbed by the body, and reflections from deeper inside the body are lost. Figure 1 – Above: Ultrasound pulse passes through the abdomen, reflecting from surfaces in its path. Middle: Reflected pulses plotted as a function of time (A-scan) when received by the transducer. Time is proportional to distance of travel. The vertical dashed lines point out which reflected pulse goes with which surface. Below: B-mode display for the same echoes: the brightness of each dot is related to signal strength. The pulse-echo technique for medical imaging works as follows. A brief pulse of ultrasound is emitted by a transducer, which is a device that transforms an electrical pulse into a sound-wave pulse – as a loudspeaker does. Part of the pulse is reflected at various interface surfaces in the body, and most (usually) continues on. The detection of the reflected pulses is done by the same transducer, which transforms the sound pulses into electrical pulses – as a microphone does. The detected pulses can then be displayed on the screen of a monitor. As an example, consider a sound pulse passing through the abdomen (Figure 1). At various interfaces in the body, part of the pulse is reflected. The time elapsed from when the pulse is emitted to when its reflection (echo) is received is proportional to the distance to the reflecting surface. For example, if the distance from the transducer to the vertebra is 25 cm, the pulse travels a round-trip distance of 2⋅0.25 = 0.50 m, and the time taken is t = d/v = 0.50/1540 = 3.2⋅10–4 s = 320 µs. A pulse reflected from an object only 10 cm from the transducer would de received after only 130 µs. For the situation shown in Figure 1, the reflected pulses are plotted as a function of the time they are received by the transducer. The strength of a reflected pulse depends mainly on the differences in density of the two materials on either side of the interface. It also depends on the sound velocity in each material, but this normally has little effect since in most tissues the velocity is within a few percent of the average 1540 m/s. Exceptions are bone (4000 m/s) and air (340 m/s). At interfaces involving bone or the lungs, most of the sound pulse is reflected. So, ultrasound cannot be used as a probe beyond such interfaces. Also, generally the transducer is placed in contact with a person’s body, or the body and transducer are immersed in water, so as to avoid the high reflectivity at the first air-body interface, which would greatly reduce the amount of sound waves passing into the body. A trace such as shown in Figure 1 can be displayed directly on a monitor (Figure 2). Such a display is called an A-scan or A-mode scan. Far more common today is a B-scan, which can be used to form 2D images of a cross section of the body. In a B-mode scan, each echo is represented as a point, whose position is given by the time delay and whose brightness depends on the strength of the echo (Figure 1). A 2D image can be formed from a series of B-scans. The transducer is moved, and at each position it sends out a pulse and receives echoes as shown in Figure 3. Each B-scan trace can be plotted, spaced appropriately one below the other, to form an image on a display terminal. Only ten lines are shown in Figure 3, so the image is crude. More lines give a more precise image. A faster scan can be obtained by using an array of transducers, or by rotating a single transducer about a point so it ‘looks’ in a sequence of different directions through the body. Figure 2 – An A-scan of an eye. Figure 3 – Above: Ten traces are made across the abdomen by moving the transducer, or by using an array of transducers. Below: The echoes are plotted to produce the image. More closely spaced traces would give a more detailed image. Reference – Adapted from Giancoli, Douglas C. (1998), Physics: principles with applications (5th edition, pp. 370-374). Upper Saddle River, NJ: Prentice Hall. Ultrasound imaging in medicine began during and shortly after World War 2. In the USA Holmes & Howry experimented with water tanks to achieve acoustic coupling when trying to obtain detailed images of soft tissues (Figure 4). From the mid 1960s onwards, the advent of commercially available systems allowed the wider dissemination of the technique. Rapid technological advances in electronics and piezoelectric materials provided further improvements. Today ultrasound is by far the most used medical imaging technique in the world, since it is relatively cheap as compared to MRI or CT, safe, non-invasive and painless. The best-known application of ultrasound is pregnancy (Figure 5): the examination is not harmful at all to the foetus. The use of X-rays or radioactive tracers, however, would give rise to a higher probability to induction of cancer. This is especially so for foetuses or babies, as radiation damage is most likely to occur in fast dividing cells. Figure 4 – Early ultrasound image of the normal neck made by Holmes & Howry in 1956. The volunteer was submerged in degassed water and scanned through 360°. Figure 5 – Ultrasound image of a 35 weeks old human foetus (with head at the right) within the uterus. Image formation The ultrasound source is a transducer: a piezoelectric crystal. If a voltage is put across such a crystal, it compresses. Therefore, an alternating voltage generates causes the crystal to oscillate and produce pressure waves or sound waves. The crystal not only converts an electric signal into a mechanical motion, but also the other way around. Therefore, the transducer can also be used as a sound wave detector. If the ultrasound waves travel through matter with a higher density (with the molecules closer together), the wave velocity is higher (Figure 6). For example, the wave velocity in gas (air) is 340 m/s, while that in water is 1560 m/s. That is easy to understand when one considers vibrations in matter in which molecules have a larger chance to interact with other molecules, as is the case in dense tissues. Large differences in densities at the boundary of two tissues cause reflection of the pressure waves (Figure 7). In the body reflections (or echoes) arise at the boundaries of different tissues. Hence, the anatomy of different organs can be visualised, if we are able to measure the reflections. The transducer not only emits ultrasound waves into the patient, it also receives the reflected waves. Reflections from deeper in the tissue have travelled a larger distance, both on the path from transducer to the density border and on the way back to the transducer. Therefore, the time delays between emission and detection vary with ‘depth’. With the help of these small time delays, the corresponding depths can be calculated and an image can be reconstructed. Since the transducer cannot function as both an emitter and a detector at the same time, the signal has to be pulsed. So the transducer only functions as a detector between two pulses. Figure 6 – Ranges of measured values for the speed of sound in various biological and non-biological media. The data for soft tissues and biological liquids fall within a narrow range. Figure 7 – Scattering – reflection and refraction – at a boundary surface between two media, of characteristic acoustic impedances Z1 and Z2 and speeds of sound c1 and c2. The intensity of the reflected waves is described by the greyscale of the ultrasound image: the stronger the reflection that comes from a certain depth, the lighter the pixel is. Locations in smooth tissue having the same overall density (so, little or no reflecting surfaces) are therefore black. Transducers can be divided into two classes of different frequencies: low frequency transducers (2.5-5 MHz) which are used to visualise tissues at larger penetration depths, and high frequency transducers (7.5-10 MHz) which offer a better resolution at superficial depths. In ultrasound imaging air is the best contrast agent. Since it has a much lower wave velocity than all human tissues, reflections on air are strong. Recently, injectable contrast media with micro bubbles (less than 10 µm in diameter) have appeared on the market. These are small protein bubble membranes filled with air or perfluorocarbon to be used for visualising blood vessels. 3D Ultrasound A 3D ultrasound image is made with a special 3D transducer. This sector transducer has an array of small transducers emitting planar waves as a function of time in the tissue (Figure 8). The resulting wave front has a specific direction, depending on the time delays in the transducer array. By varying these time delays, the direction of the wave front can be changed. Thus reflections from different directions can be measured, from which a 3D ultrasound image is built on the same principles as in 2D. Figure 8 – Left: Phased array ultrasound probe. Middle and right: Examples of a 3D ultrasound image: face and hands, ear of a foetus. Doppler Ultrasound The most commonly used ultrasonic flow measurement technique is called Doppler Ultrasound. The Doppler shift is the phenomenon that the frequency of a wave depends on the relative velocity between the emitter and detector of the wave – compare this to the change in pitch of the horn of a passing ambulance. Suppose red blood cells, for example, move with velocity v and direction θ with respect to the direction of the transmitted ultrasound waves (Figure 9). The result is a shift in frequency of the backscattered ultrasound waves – the blood cells act like a moving source of (reflected) ultrasound waves. Figure 9 – Doppler ultrasound system illustrating the angle θ appearing in the backscatter Doppler equation. Figure 10 – Examples of Doppler ultrasound flow measurement. The (false) red colour represents a flow away from the user, the blue colour a flow towards the user – compare this to the red shift of galaxies. This Doppler shift ∆f can be measured and used to calculate the velocity v of the red blood cells from the following equation: ∆f = ±(2⋅f0⋅v⋅cosθ )/c In this expression f0 is the frequency emitted by the transducer, and c is the velocity of sound in the tissue. This technique is used for studying blood flow behaviour in vessels (Figure 10), including the beating of the heart. Because the frequency shift of 0-200 Hz lies in the audible frequency range, a common method for subjective interpretation of Doppler-shift signals from moving blood is to amplify the signals and just listen to them. Physics principles • Sound waves: frequency, wavelength, velocity, absorption, reflection, echo, wave front, Doppler shift. Additional links http://electronics.howstuffworks.com/ultrasound.htm

![Jiye Jin-2014[1].3.17](http://s2.studylib.net/store/data/005485437_1-38483f116d2f44a767f9ba4fa894c894-300x300.png)
