Q1 09 - Q4 11
Three year RQ analysis of Euro 300
When the going gets tough…
Since starting in 1998, AQ Research has been measuring
the performance of equity research and publishing the
results through Yearbooks and quarterly reports, as well
as through AQ Online. Our AQ Select quarterly reports
look at the performance of research on the AQ300, a
selection of large market capitilisation companies with a
robust variety of analyst research available.
By any measure the past three years have been
the most turbulent since we started, with high volatility
and large index swings all underpinned by low trading
volumes. Another feature is the high correlation
between stocks, for instance as measured by the CBOE
S&P500 Implied Correlation Coefficient. We believe that
investors are primarily focused on asset allocation rather
than stock picking within equity.The result is a focus on
the most liquid (large cap) stocks which are cheap to
buy and sell.The other corollary of these lower traded
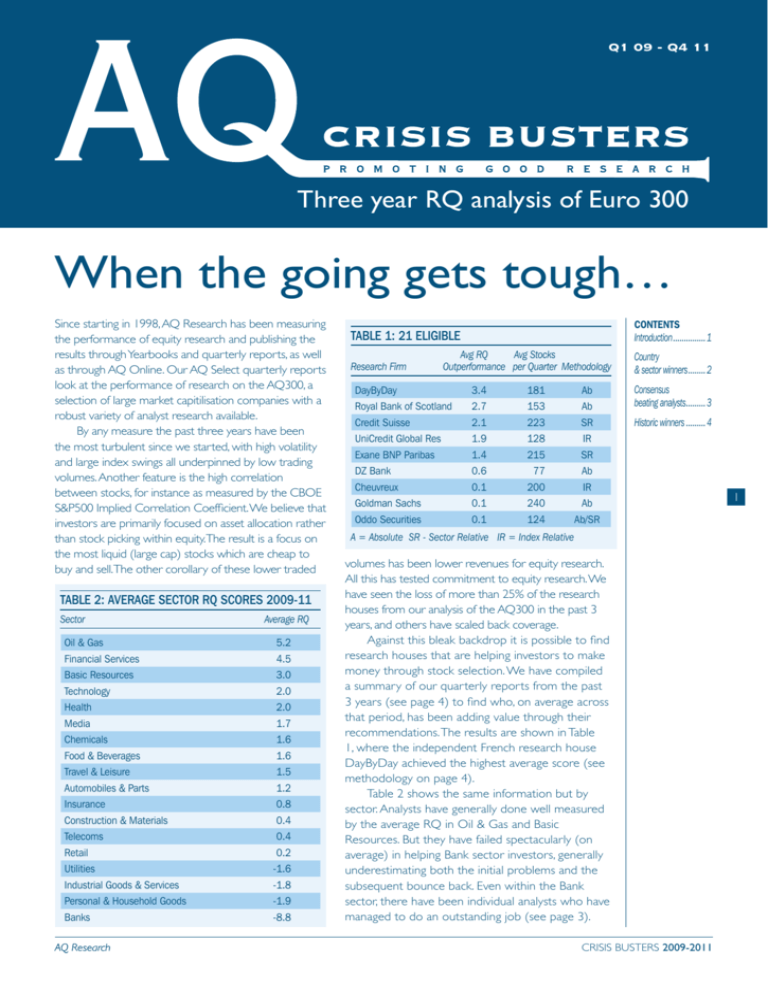
TABLE 2: AVERAGE SECTOR RQ SCORES 2009-11
Sector
Average RQ
Oil & Gas
5.2
Financial Services
4.5
Basic Resources
3.0
Technology
2.0
Health
2.0
Media
1.7
Chemicals
1.6
Food & Beverages
1.6
Travel & Leisure
1.5
Automobiles & Parts
1.2
Insurance
0.8
Construction & Materials
0.4
Telecoms
0.4
Retail
0.2
Utilities
-1.6
Industrial Goods & Services
-1.8
Personal & Household Goods
-1.9
Banks
-8.8
AQ Research
CONTENTS
TABLE 1: 21 ELIGIBLE
Research Firm
Introduction................1
Avg RQ
Avg Stocks
Outperformance per Quarter Methodology
Country
& sector winners.........2
DayByDay
3.4
181
Ab
Royal Bank of Scotland
2.7
153
Ab
Consensus
beating analysts..........3
Credit Suisse
2.1
223
SR
Historic winners..........4
UniCredit Global Res
1.9
128
IR
Exane BNP Paribas
1.4
215
SR
DZ Bank
0.6
77
Ab
Cheuvreux
0.1
200
IR
Goldman Sachs
0.1
240
Ab
Oddo Securities
0.1
124
Ab/SR
A = Absolute SR - Sector Relative IR = Index Relative
volumes has been lower revenues for equity research.
All this has tested commitment to equity research. We
have seen the loss of more than 25% of the research
houses from our analysis of the AQ300 in the past 3
years, and others have scaled back coverage.
Against this bleak backdrop it is possible to find
research houses that are helping investors to make
money through stock selection. We have compiled
a summary of our quarterly reports from the past
3 years (see page 4) to find who, on average across
that period, has been adding value through their
recommendations. The results are shown in Table
1, where the independent French research house
DayByDay achieved the highest average score (see
methodology on page 4).
Table 2 shows the same information but by
sector. Analysts have generally done well measured
by the average RQ in Oil & Gas and Basic
Resources. But they have failed spectacularly (on
average) in helping Bank sector investors, generally
underestimating both the initial problems and the
subsequent bounce back. Even within the Bank
sector, there have been individual analysts who have
managed to do an outstanding job (see page 3).
CRISIS BUSTERS 2009-2011
1
COUNTRY AND SECTORS WINNERS
COUNTRY RESULTS
SectorFirst
2
Second
Third
Austria
Kepler Capital Markets
22.2 Cheuvreux
17.6 Raiffeisen
14.0
Belgium
Exane BNP Paribas
7.6
6.7
6.3
Denmark
Credit Suisse
26.3 Handelsbanken Cap Mrkts 23.5 ABG Sundal Collier
7.4
Finland
Exane BNP Paribas
14.8 FIM
8.4
Cheuvreux
6.3
France
DayByDay
3.7
DZ Bank
3.6
Standard and Poor’s
3.0
Germany
Royal Bank of Scotland
10.7 Natixis Securities
5.8
Berenberg Bank
3.9
Greece
UniCredit Global Res
28.9 Goldman Sachs
22.5 Natixis Securities
21.5
Ireland
NCB Stockbrokers (ESN) 16.8 AlphaValue
15.1 Royal Bank of Scotland
8.2
Italy
Royal Bank of Scotland
14.3 DayByDay
6.9
UniCredit Global Res
5.4
Netherlands
AlphaValue
6.7
DayByDay
5.5
Credit Suisse
5.4
Norway
Kaupthing Research
9.1
AlphaValue
7.4
ABG Sundal Collier
7.2
Portugal
Natixis Securities
12.3 Exane BNP Paribas
7.2
Credit Suisse
6.9
Spain
Exane BNP Paribas
6.4
5.1
LBBW
4.8
Sweden
Royal Bank of Scotland
11.1 Swedbank Securities
6.9
ABG Sundal Collier
6.7
Switzerland
Metzler Seel. Sohn & Co. 11.1 Standard and Poor’s
5.1
UniCredit Global Res
4.8
UK
Numis Securities
4.9
DayByDay
3.4
8.9
Natixis Securities
Royal Bank of Scotland
AlphaValue
Cheuvreux
SECTOR RESULTS
SectorFirst
Second
Third
Automobiles & Parts
National Bank
21.2 ESN
15.9 Royal Bank of Scotland
14.6
Banks
Exane BNP Paribas
12.2 Credit Suisse
9.4
6.6
Basic Resources
Oddo Securities
15.4 SG Securities
11.1 Seymour Pierce Ltd.
11.0
Chemicals
Metzler Seel. Sohn & Co. 10.6 DZ Bank
10.4 LBBW
8.7
Construction & Materials
Standard and Poor’s
10.8 DayByDay
5.8
ING Financial Markets
4.7
Financial Services
Kepler Capital Markets
8.3
5.0
DayByDay
4.5
Food & Beverages
AlphaValue
13.8 Investec Securities
7.7
DayByDay
3.1
Health
Goldman Sachs
5.2
5.1
ESN
3.6
Industrial Goods & Srvcs
Handelsbanken Cap Mrkts 14.4 Swedbank Securities
10.5 DayByDay
8.7
Insurance
DayByDay
13.4 AlphaValue
7.0
Metzler Seel. Sohn & Co. 4.6
Media
Numis Securities
20.6 Charles Stanley
6.7
AlphaValue
6.4
Oil & Gas
Royal Bank of Scotland
12.1 AlphaValue
7.7
SG Securities
5.3
Personal & Household Gds Royal Bank of Scotland
5.6
Charles Stanley
5.6
Seymour Pierce Ltd.
5.0
Retail
SG Securities
9.8
AlphaValue
3.3
Goldman Sachs
1.0
Technology
WestLB
15.1 DZ Bank
14.6 DayByDay
5.2
Telecoms
AlphaValue
10.0 Kepler Capital Markets
5.4
Cheuvreux
1.7
Travel & Leisure
LBBW
10.1 Standard and Poor’s
8.9
Oddo Securities
8.5
Utilities
BBVA
6.6
4.7
Natixis Securities
4.6
CRISIS BUSTERS 2009-2011
SG Securities
Berenberg Bank
Credit Suisse
Kepler Capital Markets
AQ Research
CONSENSUS BEATING ANALYSTS
CONSENSUS BEATERS
We have also derived from our database
the outperformance of individual analysts as
compared to the firms that collectively employ
them. To qualify for this table, an analyst must
have covered at least 3 stocks in the AQ300 for
at least 7 quarters.
l The outperformance measures the analyst’s RQ
score (see page 3) against the average of all
analysts covering the same company. This residual
is then averaged across the all the analyst’s
coverage. This particularly identifies analysts who
take a contrarian but correct view.
l Five of the top 25 analysts are covering Industrial
Goods & Services (about 10% of the AQ300
l
companies in this sector), four are covering
Banks (16% of AQ300) and three cover the
Telecommunications sector (5%).
l The worthy winner by a good margin is
Jonathan Pierce, one time banks analyst at
Credit Suisse. The biggest component of his
score was a buy recommendation on Barclays
in March 2009 when all other analysts were
either neutral or negative on the stock. He was
also one of the first analysts to downgrade
HBOS and RBS in summer 2007. Currently he is
reported to be inspiring the next generation of
potential financial analysts, teaching mathematics
in a secondary school.
RECOMMENDATION CONSENSUS BEATING RQ ANALYSTS
Analyst
Current Broker
RQ outperformance
Average #
stocks/quarter
Average # top stocks/quarter
Jonathan Pierce
Credit Suisse*
49.3
3
0.6
Hampus Engellau
Handelsbanken Capital Markets
33.8
3
0.9
Pierre Chedeville
CM-CIC (ESN)
28.1
5
1.3
Ulle Wörner
LBBW
26.4
3
1.0
Dirk Becker
Kepler Capital Markets
26.1
7
1.6
Lorna Tilbian
Numis Securities
25.9
3
1.0
Mats Liss
Swedbank Securities
25.3
3
0.9
Thomas Langer
WestLB
25.0
4
0.7
Sandy Morris
Royal Bank of Scotland
24.0
4
1.2
Alessandro Migliorini
Helvea SA
23.3
3
0.6
Niclas Höglund
Swedbank Securities
22.5
3
0.9
Tom Gidley-Kitchin
Charles Stanley
22.4
10
1.7
Tim Schuldt
equinet (ESN)
20.6
6
0.8
Axén Magnus
Evli Bank
20.4
5
1.1
Alexander Peterc
Exane BNP Paribas
16.6
3
0.4
Samuel Henry-Diesbach
Kepler Capital Markets
16.5
3
1.1
Hans Pluijgers
Cheuvreux
16.2
7
0.8
Morten Normann
Kaupthing Research
16.1
3
0.6
Peter Spengler
DZ Bank
16.1
5
1.3
Sophie Cabo-Broseta
AlphaValue
14.7
10
3.9
Mark Freshney
Credit Suisse
14.4
7
1.6
Tania Gold
UniCredit Global Research
14.1
8
1.0
Jean-Michel Salvador
AlphaValue
13.9
16
3.8
Jose Asumendi
Royal Bank of Scotland
13.9
9
1.1
Guillaume Tiberghien
Exane BNP Paribas
13.7
6
0.3
3
* to June 2011
AQ Research
CRISIS BUSTERS 2009-2011
HISTORIC WINNERS
QUARTERLY WINNERS
Q1 2009
Q2 2009
BBVA
13.3
Credit Suisse
Credit Suisse
12.0
Cheuvreux
11.3
Q4 2009
DayByDay
7.9
DayByDay
9.9
Cheuvreux
9.1
Credit Suisse
7.5
ESN
7.4
Exane BNP Paribas
7.8
Royal Bank of Scotland
5.2
DZ Bank
7.3
Exane BNP Paribas
9.9
BBVA
6.0
Exane BNP Paribas
4.7
Kepler Capital Markets
3.8
Cazenove & Co
8.9
Cazenove & Co
5.5
Cheuvreux
4.2
UniCredit Global Research
2.5
Natixis Securities
8.2
Natixis Securities
3.5
Oddo Securities
2.3
Royal Bank of Scotland
2.2
Q1 2010
Q2 2010
Q3 2010
Q4 2010
DZ Bank
19.5
DayByDay
6.9
LBBW
4.5
Royal Bank of Scotland
4.8
ESN
15.2
DZ Bank
6.6
Royal Bank of Scotland
2.9
LBBW
4.1
DayByDay
8.2
Royal Bank of Scotland
3.4
DZ Bank
2.8
Charles Stanley
4.0
Royal Bank of Scotland
6.7
UniCredit Global Research
3.3
UniCredit Global Research
2.7
DZ Bank
3.9
Goldman Sachs
1.9
ESN
2.7
ING Financial Markets
1.0
DayByDay
3.6
Oddo Securities
1.3
Goldman Sachs
2.1
SG Securities
0.7
SG Securities
2.1
Q1 2011
4
Q3 2009
9.9
Q2 2011
Q3 2011
Q4 2011
DayByDay
3.2
Charles Stanley
7.6
DayByDay
6.0
Credit Suisse
6.2
DZ Bank
3.1
Royal Bank of Scotland
5.2
Credit Suisse
5.7
UniCredit Global Research
4.6
AlphaValue
2.3
Oddo Securities
3.1
UniCredit Global Research
4.5
Exane BNP Paribas
3.7
Royal Bank of Scotland
2.2
AlphaValue
2.5
Oddo Securities
4.2
Oddo Securities
3.6
SG Securities
1.8
SG Securities
1.8
Exane BNP Paribas
4.0
AlphaValue
2.3
Charles Stanley
0.4
DZ Bank
1.6
Cheuvreux
2.9
DayByDay
2.3
RQ METHODOLOGY
The methodology adopted in RQ has been developed after consultation with the industry. It is very different to our AQ report.
The analysis scores research houses differently, depending on whether they have absolute or relative recommendations. The
period over which we have examined recommendations is the 12 months to the end of each quarter, averaged to give an
overall result. Each recommendation made during this period has been assessed over its “lifetime” (ie until it is changed). Current
recommendations are therefore “open” and evaluation of them will continue in the next quarterly report until they are changed.
Analysts are scored on the basis of the percentage share price movement (up or down) during the lifetime of a
particular recommendation.
Those with absolute recommendations are measured on the basis of the percentage change in the share price during
the lifetime of the recommendation. Those with relative recommendations are measured on the price movement relative
to the price of the relevant index. This is a country index (eg DAX 30 or FTSE All Share) for those houses which make
recommendations on a local index basis. Or it is a sector index (the market sectors within the Dow Jones 600) for those
which make sector relative recommendations. Scores are calculated as follows:
l Strong Buy recommendation receives the percentage share price movement times 1.25
l Buy recommendation receives the percentage share price movement times 1
l Hold has no score
l Reduce recommendation receives the percentage share price movement times -1
l Sell recommendation receives the percentage share price movement times -1.25
There is no theoretical limit – positive or negative – to the score which an analyst could achieve. Where share prices have risen
by 100%, an analyst with a strong buy throughout the period could score 125 (or conversely -125 if the analyst had a strong
sell on this stock). When markets and sector indices are trending upwards this tends to favour absolute analysts and when they
are trending lower, relative analysts tend to do better.
To be included in the overall table a research house needs to analyse research in relation to at least 20% of the Euro
300 companies analysed, for at least 7 of the 12 calendar quarters in the analysis. An analyst must cover at least 3 stocks for a
minimum of 7 quarters.
Published by: AQ Research Ltd
40 Bowling Green Lane, London EC1R 0NE
Tel: +44 (0)20 3239 3854
Email: subs@aqresearch.com
Website: www.aqresearch.com
Managing Director: William Russell-Smith
Technical Director: Peter Linnell
Data co-ordinator: Debbie Lucas
Design: Forshaw Design Ltd Printed by: DG3, London
CRISIS BUSTERS 2009-2011
All rights reserved. No part of this publication may be reproduced, stored in a retrieval system, or transmitted, in any
form, or by any means, electronic, mechanical, photocopying, recording, or otherwise, without the prior permission of AQ
Research. Although AQ Research has made every effort to ensure the accuracy of this publication, it cannot accept any legal
responsibility for consequences that may arise from errors or omissions or any opinions or advice given. The publication is
not a substitute for professional advice on a specific transaction.
The data and resulting calculations are not verified by all the research houses concerned. Broker estimates are updated
either daily, weekly, monthly or quarterly, depending on the frequency with which they are obtained.
ISSN: 1757-2053 ©2012 AQ Research Ltd
AQ Research

