ECO 100Y INTRODUCTION TO ECONOMICS Midterm Test # 2
advertisement
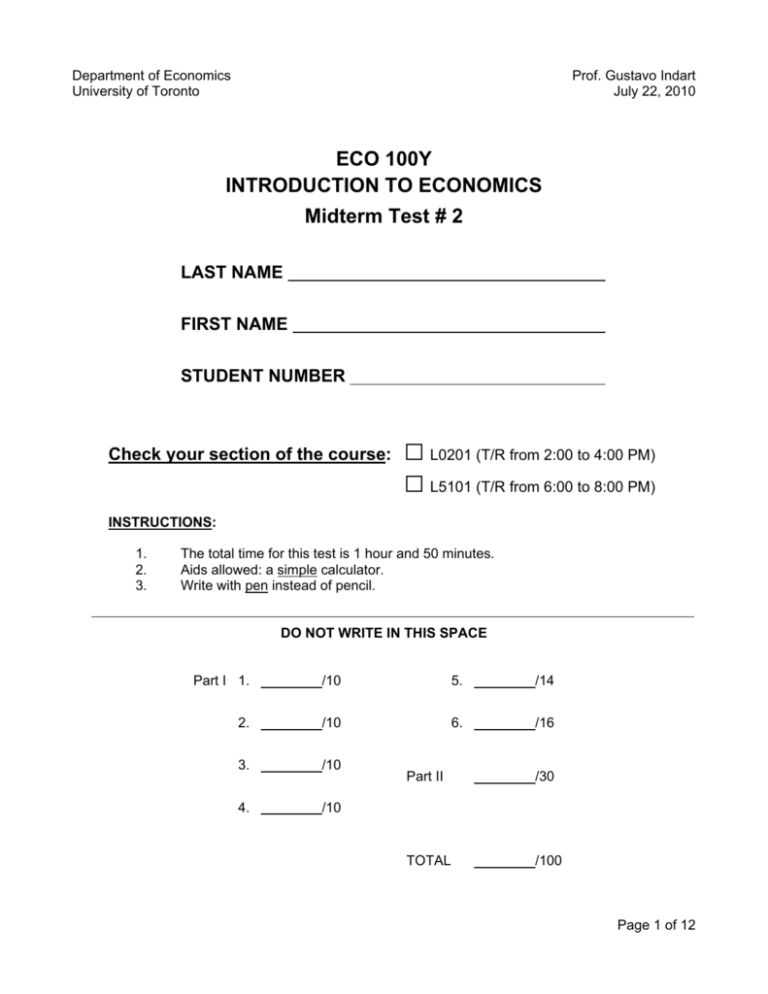
Department of Economics University of Toronto Prof. Gustavo Indart July 22, 2010 ECO 100Y INTRODUCTION TO ECONOMICS Midterm Test # 2 LAST NAME FIRST NAME STUDENT NUMBER Check your section of the course: □ L0201 (T/R from 2:00 to 4:00 PM) □ L5101 (T/R from 6:00 to 8:00 PM) INSTRUCTIONS: 1. 2. 3. The total time for this test is 1 hour and 50 minutes. Aids allowed: a simple calculator. Write with pen instead of pencil. DO NOT WRITE IN THIS SPACE Part I 1. /10 5. /14 2. /10 6. /16 3. /10 4. /10 Part II /30 TOTAL /100 Page 1 of 12 PART I (70 marks) Question 1 (10 marks) Monica owns a small firm in a perfectly competitive market. Her firm generates the following short-run information at the current level of output: the market price is $20; the average total cost is $25; the marginal cost is $25; and the average fixed cost is $5. Statement: Monica believes her firm is making economic losses and should, therefore, shut down production. Julia — an ECO100 student — advises her not to shut down but to reduce the level of output. Position: Do you agree with Julia’s advice? Use a proper diagram to analyze this situation and indicate, with reasons, whether you agree or disagree with Julia’s advice. Page 2 of 12 Question 2 (10 marks) A constant-cost, perfectly competitive industry is in long-run equilibrium. The government introduces a permanent $10 unit-tax. [Note: “Permanent” means that the unit-tax will remain in the long run.] Statement: Leonardo concludes that the long-run impact of this tax will be a $10 increase in the industry price, a decrease in both the industry output and the number of firms, but no change in the output of each firm. Position: Do you agree with Leonardo’s conclusion? Use the proper diagram(s) to analyze this situation and indicate, with reasons, whether you agree or disagree with Leonardo’s conclusion. Page 3 of 12 Question 3 (10 marks) A publisher has a monopoly in the production economic textbooks. The publisher has agreed to pay the author of a new textbook 10 percent of the total revenues from the sale of the book. Now the publisher and the author have to agree on the price to charge for the book. Statement: Since the payment to the author does not affect the marginal cost of the monopolist, Amanda concludes that the author and the publisher will agree to charge the price corresponding to the monopoly’s profit-maximizing quantity of books. Position: Do you agree with Amanda’s conclusion? Use the proper diagram to analyze this situation and indicate, with reasons, whether you agree or disagree with Amanda’s conclusion. Page 4 of 12 Question 4 (10 marks) Consider a perfectly competitive industry with 100 identical firms. The industry has the following demand: Price Quantity Demanded 3 1800 5 1200 7 800 9 500 11 300 13 200 3 18 4 25 5 34 A typical firm has the following short-run total cost (TC): Quantity Total Cost a) 0 5 1 10 2 13 6 45 Fill in the following table with this firm’s marginal cost (MC), average variable cost (AVC), and average total cost (ATC). (3 marks) Quantity Marginal Cost Average Variable Cost Average Total Cost 1 2 3 4 5 6 b) Fill in the following table to express the short-run supply curve of this industry. (3 marks) Price Quantity Supplied 3 5 7 9 11 c) What are the market equilibrium price and equilibrium quantity? Briefly explain. (2 marks) d) How much profit will each firm make? Show all your work. (2 marks) Page 5 of 12 Question 5 (14 marks) Consider a perfectly competitive, constant cost industry. The industry is initially in long-run equilibrium. $ Industry $ Typical Firm Q q a) In the left-hand side diagram above, draw the industry demand curve (D), the short-run supply curve (S), and the long-run supply (LRS) curve. Clearly show the initial long-run equilibrium price (P0) and quantity (Q0) of this industry. (2 marks) b) Briefly explain what determines the slope of the industry LRS curve you just drew. (2 mark) c) In the right-hand side diagram above, draw the short-run MC and ATC curves and the LRAC curve of a typical firm. Show in your diagram the equilibrium quantity (q0) produced by this firm. Is this firm making any economic profits? Briefly explain. (3 marks) Page 6 of 12 d) Now suppose there is an increase in demand for the product of this industry. Draw the new demand curve (D’) in the left-hand side diagram above and indicate the new short-run equilibrium price (P1) and quantity (Q1). (1 mark) e) In the right-hand side diagram above, show the typical firm’s short-run response to the change in market price from P0 to P1. Label the new quantity produced q1. Is the firm making economic profits or economic losses? Briefly explain. Show the area that represents the typical firm’s economic profits or economic losses at this new price. (3 mark) f) Explain how this industry adjusts to its new long-run equilibrium. Illustrate this adjustment both in the demand-and-supply diagram and the diagram of the typical firm. What is the new long-run equilibrium price, firm’s output, and industry output? (3 marks) Page 7 of 12 Question 6 (16 marks) Suppose that the market for photocopy services around St. George campus consists of n identical, perfectly competitive firms. The expressions for the demand and supply curves for photocopy services in this market are P = 25 – 0.001Q and P = 5 + 0.001Q, where P is the price of a photocopy (measured in cents) and Q is the quantity of photocopies per week. The expression for the short-run marginal cost curve of a typical firm is MC = 5 + 0.1q, where q is the firm’s quantity of photocopies per week. The St. George campus’s photocopy industry is initially in long-run equilibrium. a) What are the initial market equilibrium price and market equilibrium quantity? What is the quantity supplied by a typical firm in this equilibrium? What is the number of firms (n) in this market? Show all your work. (3 marks) b) In the diagrams below, draw the industry demand (D) and short-run supply (S) curves and the typical firm’s marginal cost (MC) curve. Clearly show the industry equilibrium and the typical firm’s equilibrium in these diagrams. Draw the typical firm’s short-run average total cost (AC) in the diagram below, assuming that the AC curve has the usual U-shape. (3 marks) $ Industry $ Q Typical Firm q Page 8 of 12 c) Suppose now that all the firms in this market agree to form a cartel and behave collectively as a non-regulated monopoly. What is the expression for the cartel’s MC curve? What is the expression for the cartel’s marginal revenue (MR) curve? Draw in your diagram above the cartel’s MR curve. (3 marks) d) At what level of output will the cartel’s profits be maximized? What price will the cartel charge at this profit-maximizing level of output? What output will a typical firm produce as a complying member of the cartel? Show all your work. (3 marks) e) Neatly show in your diagram the profits that a typical firm would make if all cartel members complied with the agreement. (1 mark) f) Suppose now that one firm cheats on the agreement without any other cartel member being able to find out. What level of output does this firm produce? Show all your work. (2 marks) g) Neatly show in your diagram the profits that the cheating firm will make if the other cartel members do not find out. (1 mark) Page 9 of 12 PART II (30 marks) Instructions: • Multiple choice questions are to be answered using a black pencil or a black or blue ballpoint pen on the separate SCANTRON sheet being supplied. • Be sure to fill in your name and student number on the SCANTRON sheet! • Each question is worth 3 marks. No deductions will be made for incorrect answers. • Write your answers to the multiple choice questions ALSO in the table below. You may use this question booklet for rough work, and then transfer your answers to each multiple choice question onto the separate SCANTRON sheet. Your answers must be on the SCANTRON sheet. In case of a disagreement, the answer to be marked is the one on the SCANTRON sheet. 1 2 3 4 5 6 7 8 9 10 11 1. Suppose a firm’s fixed costs are $100 and marginal cost is constant regardless of output. Which of the following is then true? A) Average variable cost will be rising as output rises. B) Marginal cost will equal average total cost. C) Marginal cost will be less than average variable cost. D) Average total cost will decrease when output is increased. E) None of the above. 2. If firms' marginal costs rise rapidly as output increases, the A) price elasticity of supply will tend to be lower. B) demand curve will tend to be steeper. C) elasticity of demand will tend to be lower. D) price elasticity of supply will tend to be higher. E) supply curve will tend to be flatter. 3. Consider a perfectly competitive industry in long-run equilibrium. In the short run, an increase in the price of capital will lead to A) a decrease in the firm’s output. B) an increase in the market price. C) a decrease in the firms’ profits. D) a decrease in the industry’s output. E) all of the above. 4. Suppose a firm producing digital cameras is operating at a level of output where marginal cost is lower than average total cost. If the firm produces one more camera, average variable cost will A) fall. B) remain constant. C) be at a minimum. D) rise. E) Not enough information to determine. Page 10 of 12 Information in Table 1 should be used to answer questions 5 and 6 below. The data in the table show the total output for a firm when specified amounts of labour are combined with a fixed amount of capital. When answering the questions, you are to assume that the wage per unit of labour is $15 and the cost of the capital is $100. TABLE 1 Labour per unit of time 0 1 2 3 4 5 Total output 0 25 75 175 250 305 5. Refer to Table 1. The marginal cost of producing the 250th unit is approximately A) 35 cents. B) 30 cents. C) 25 cents. D) 20 cents. E) None of the above is correct. 6. Refer to Table 1. The average total cost for 250 units of output is approximately A) 40 cents. B) 36 cents. C) 24 cents. D) 20 cents. E) None of the above is correct. 7. If losses are being made by firms in a competitive industry, some firms will eventually exit. This will shift the industry A) demand curve leftward, causing market price to fall in the short run. B) demand curve rightward, causing market price to rise in the short run. C) short-run supply curve rightward, causing market price to rise in the short run. D) short-run supply curve leftward, causing market price to fall in the short run. E) None of the above is true. 8. In the short run, if average total cost is increasing as output rises, then A) average variable cost must be increasing. B) marginal cost must be below average total cost. C) average fixed costs must be increasing. D) average total cost is no longer equal to the sum of average variable cost and average fixed cost. E) none of the above is correct. 9. For a competitive firm, marginal revenue is A) less than price. B) equal to price but less than average revenue. C) equal to price but greater than average revenue. D) equal to both price and average revenue. E) greater than average revenue and less than price Page 11 of 12 10. Suppose that a monopolist can sell 20 units of output per day for a price of $5 each and 21 units of output per day for $4.90 each. The marginal revenue for the 21st unit is equal to A) -$0.10. B) $0.10. C) $2.90. D) $4.90. E) uncertain, as not enough information is provided to compute marginal revenue. Bonus question (an additional 3 marks): 11. In a cartel, the incentive to cheat is significant since A) each individual member has the incentive to restrict its own output to maximize profits. B) each firm has the incentive to expand output to increase its profits. C) the marginal cost is greater than the cartel price at the profit-maximizing output level. D) each firm has the incentive to raise its price to reap monopoly rewards. E) None of the above. Page 12 of 12
