Algebra 2 Linear Regression Worksheet
advertisement
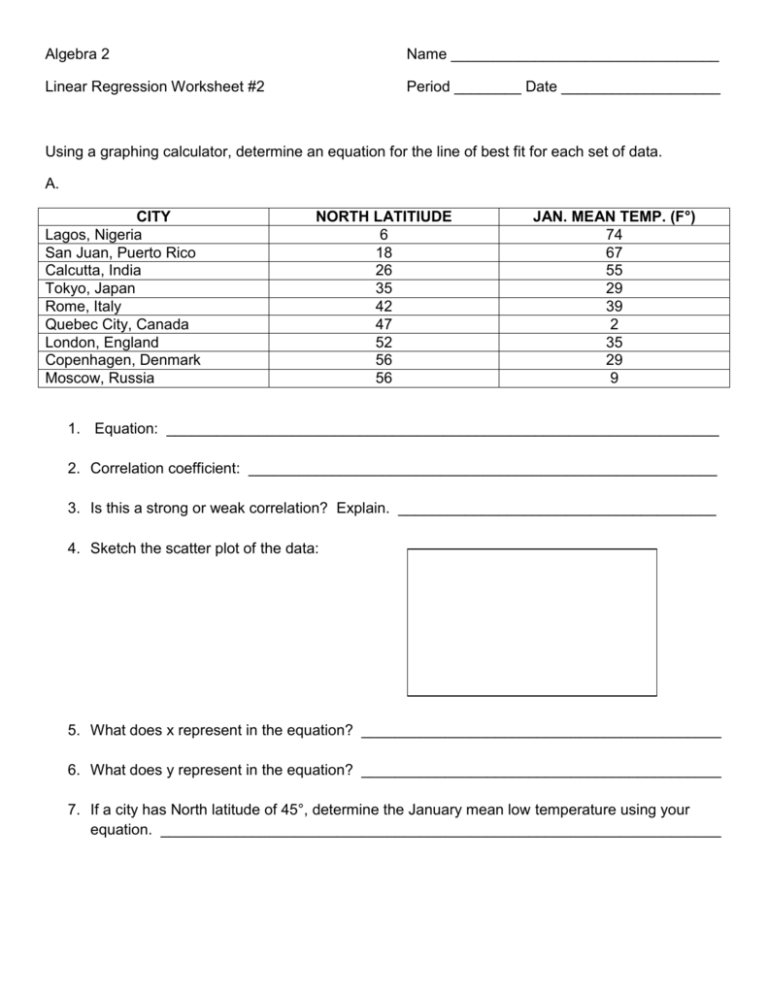
Algebra 2 Name ________________________________ Linear Regression Worksheet #2 Period ________ Date ___________________ Using a graphing calculator, determine an equation for the line of best fit for each set of data. A. CITY Lagos, Nigeria San Juan, Puerto Rico Calcutta, India Tokyo, Japan Rome, Italy Quebec City, Canada London, England Copenhagen, Denmark Moscow, Russia NORTH LATITIUDE 6 18 26 35 42 47 52 56 56 JAN. MEAN TEMP. (F°) 74 67 55 29 39 2 35 29 9 1. Equation: __________________________________________________________________ 2. Correlation coefficient: ________________________________________________________ 3. Is this a strong or weak correlation? Explain. ______________________________________ 4. Sketch the scatter plot of the data: 5. What does x represent in the equation? ___________________________________________ 6. What does y represent in the equation? ___________________________________________ 7. If a city has North latitude of 45°, determine the January mean low temperature using your equation. ___________________________________________________________________ B. FAST FOOD ITEM Burger King Whopper McDonald’s Big Mac Wendy’s Big Classic Arby’s Roast Beef Hardee’s Roast Beef Roy Roger’s Roast Beef Burger King Whaler McDonald’s Filet-O-Fish Arby’s Chicken Breast Sandwich Burger King chicken Tender Church’s Fried Chicken Hardee’s Chicken Filet Sandwich Kentucky Fried Chicken (2 pieces) Kentucky Chicken Nuggets McDonald’s Chicken Nuggets Roy Roger’s Chicken (2 pieces) Wendy’s Chicken Filet Sandwich CALORIES 584 572 500 365 338 335 478 415 567 223 487 431 460 286 286 519 479 GRAMS OF FAT 33 34 28 19 17 11 26 23 32 12 35 20 31 17 18 35 24 1. Equation: __________________________________________________________________ 2. Correlation coefficient: ________________________________________________________ 3. Is this a strong or weak correlation? Explain. ______________________________________ 4. Sketch the scatter plot of the data: 5. What does x represent in the equation? ___________________________________________ 6. What does y represent in the equation? ___________________________________________ 7. If Bonin’s Big Burger contains 38g of fat, determine its calories. (Be careful!) _____________ C. YEAR AFTER 1900 AIDS CASES 90 41,616 91 45,524 92 47,106 93 103,228 94 426,978 95 513,486 96 562,166 97 641,086 1. Equation: __________________________________________________________________ 2. Find the number of aids cases in 2003. ___________________________________________ 3. What factor(s) does your equation not take into account? ____________________________ ___________________________________________________________________________ ___________________________________________________________________________
