PTC PCR II:
Restriction Enzymes
& Gel Electrophoresis
Objective
To apply what we’ve learned about genetics, molecular biology, and recombinant DNA to a
specific human genetic trait.
Background
Mammals are believed to distinguish only five basic tastes: sweet, sour, bitter, salty, and
umami (the taste of monosodium glutamate). Taste recognition is mediated by specialized
taste cells that communicate with several brain regions through direct connections to sensory
neurons. Taste perception is a two-step process. First, a taste molecule binds to a specific
receptor on the surface of a taste cell. Then, the taste cell generates a nervous impulse, which is
interpreted by the brain. For example, stimulation of “sweet cells” generates a perception of
sweetness in the brain. Recent research has shown that taste sensation ultimately is
determined by the wiring of a taste cell to the cortex, rather than the type of molecule bound
by a receptor. So, for example, if a bitter taste receptor is expressed on the surface of a “sweet
cell,” a bitter molecule is perceived as tasting sweet.
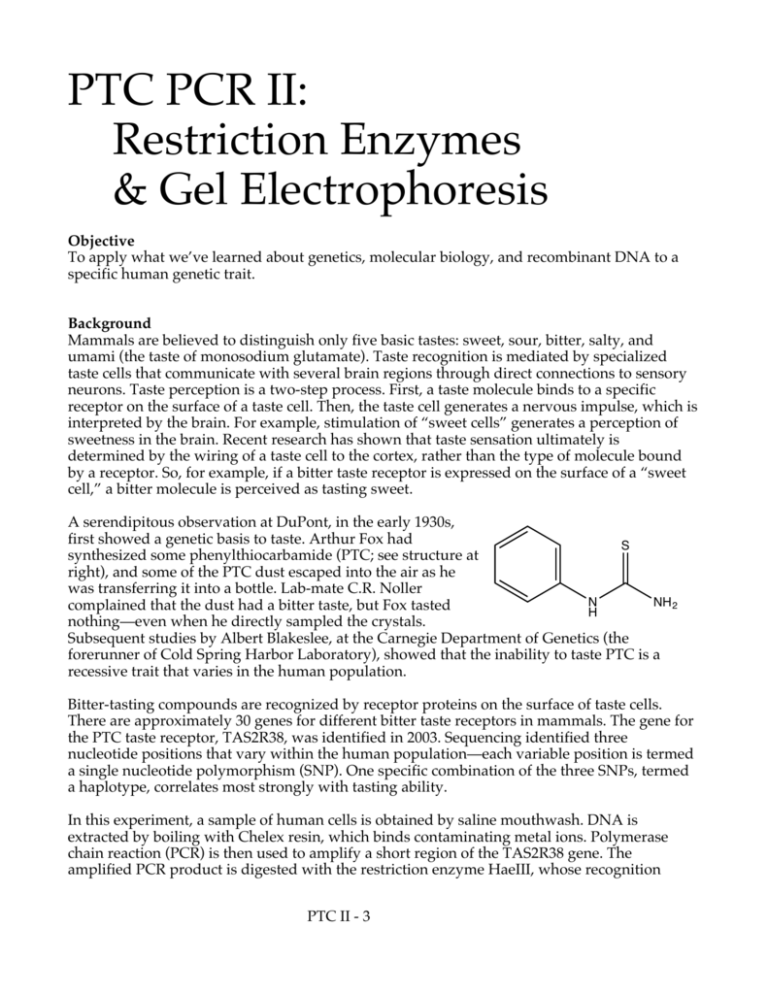
A serendipitous observation at DuPont, in the early 1930s,
first showed a genetic basis to taste. Arthur Fox had
S
synthesized some phenylthiocarbamide (PTC; see structure at
right), and some of the PTC dust escaped into the air as he
was transferring it into a bottle. Lab-mate C.R. Noller
N
NH 2
complained that the dust had a bitter taste, but Fox tasted
H
nothing—even when he directly sampled the crystals.
Subsequent studies by Albert Blakeslee, at the Carnegie Department of Genetics (the
forerunner of Cold Spring Harbor Laboratory), showed that the inability to taste PTC is a
recessive trait that varies in the human population.
Bitter-tasting compounds are recognized by receptor proteins on the surface of taste cells.
There are approximately 30 genes for different bitter taste receptors in mammals. The gene for
the PTC taste receptor, TAS2R38, was identified in 2003. Sequencing identified three
nucleotide positions that vary within the human population—each variable position is termed
a single nucleotide polymorphism (SNP). One specific combination of the three SNPs, termed
a haplotype, correlates most strongly with tasting ability.
In this experiment, a sample of human cells is obtained by saline mouthwash. DNA is
extracted by boiling with Chelex resin, which binds contaminating metal ions. Polymerase
chain reaction (PCR) is then used to amplify a short region of the TAS2R38 gene. The
amplified PCR product is digested with the restriction enzyme HaeIII, whose recognition
PTC II - 3
sequence includes one of the SNPs. One allele is cut by the enzyme, and one is not—producing
a restriction fragment length polymorphism (RFLP) that can be separated on a 2% agarose gel.
Each student scores his or her genotype, predicts their tasting ability, and then tastes PTC
paper.
Overview
In the first of two lab sessions, a sample of human cells is obtained by saline mouthwash from
each student in the lab. DNA is extracted by boiling with Chelex resin, which binds
contaminating metal ions. Polymerase chain reaction (PCR) is then used to amplify a 221 baseSingle-Nucleotide Polymorphism to Predict Bitter-Tasting Ability
17
pair (bp) region of the TAS2R38 gene.
In the second session, The amplified PCR product is digested with the restriction enzyme
HaeIII, whoseRESULTS
recognition
includes one of the SNPs. The taster allele is cut by HaeIII
ANDsequence
DISCUSSION
to give a 44bp and a 177bp fragment, while the non-taster allele is not cut at all—producing a
restriction fragment length polymorphism (RFLP) that can be separated on a 2% agarose gel.
Each student scores
his or diagram
her genotype,
predicts
their tasting
and then tastes PTC
The following
shows how
PCR amplification
andability,
restriction
paper.
digestion identifies the G-C polymorphism in the TAS2R38 gene. The “C”
allele, on the right, is digested by HaeIII and correlates with PTC tasting.
The PCR reaction is shown schematically below:
WARNINGS:
1. In general, the lab is unforgiving of mistakes like using the wrong solution or taking the
wrong amount. The construction folks at “This Old House”, say “Measure twice; cut
once.“ We’ll adapt this to “Check twice; pipette once”.
2. Although the chemcials we use are almost harmless, you should be careful with them.
Always wear gloves, don’t eat or drink in lab, and wash your hands thoroughly when you are all
done.
3. Always have a tip on the pipetman!
PTC II - 4
LAB FLOW
I.
II. AMPLIFY DNA BY PCR
ISOLATE DNA BY SALINE MOUTHWASH
Procedure I. Digest PCR products with HaeIII
1. Obtain your frozen PCR product from the previous PTC lab.
II. AMPLIFY DNA BY PCR
2. Label a 1.5-mL tube with your assigned number and with a “U” (undigested).
III. DIGEST PCR PRODUCTS WITH HaeIII
3. Use a P20 with a fresh tip to transfer 10μL of your PCR product to
the “U” tube. Store this sample on ice until you are ready to begin
Part II.
II. AMPLIFY DNA BY PCR
III. DIGEST PCR PRODUCTS WITH HaeIII
ANALYZE
IV. the
4. Have your TA add 1μL of restriction enzyme HaeIII directly into
PCR PCR PRODUCTS BY GEL ELECTRO
product remaining in the PCR tube. Label this tube with a “D” (digested).
III. DIGEST PCR PRODUCTS WITH HaeIII
5. Mix and pool reagents by pulsing in a microcentrifuge or by sharply
ANALYZE PCR
PRODUCTS
IV.vortexing.
II. tapping
AMPLIFYthe
DNAtube
BY PCR
bottom on the lab bench or by
Then,
spin BY GEL ELECTROPHORESIS
briefly in the microfuge to bring all the drops together.
IV. ANALYZE PCR PRODUCTS BY GEL ELECTROPHORESIS
6. Place your PCR tube, along with other student samples, in a thermal cycler that has been
programmed for one cycle of the following profile. The profile may be linked to a 4°C hold
III. DIGEST PCR PRODUCTS WITH HaeIII
program.
Digesting step: 37°C 30 minutes
–
IV. ANALYZE PCR PRODUCTS BY GEL ELECTROPHORESIS
–
PTC II - 5
+
e-Nucleotide Polymorphism to Predict Bitter-Tasting Ability
11
III. DIGEST PCR PRODUCTS WITH HaeIII
Procedure II: Analyze Digested PCR Products by Gel Electrophoresis
an overly thick gel,
difficult to visualize.
1.
ome cloudy as it
2. Pour 2% agarose solution to a depth that covers about 1/3 the height
of the open
teeth
of the gel
comb.
We will prepare
a 2%
agarose
in TBE buffer for you.
3. Allow the gel to solidify completely. This takes approximately 20
2. Loading aminutes.
gel can be challenging, so you should practice loading a sample into the practice
gel before loading your gel.
re buffer than
4. Place the gel into the electrophoresis chamber, and add enough 1×
II. AMPLIFY DNA BY PCR
much buffer above
TBE bufferwith
to cover
the surface
of the20
gel.
3. Use a micropipet
a fresh
tip to load
uL of pBR322/BstNI size markers
s electrical current
ANALYZE
PCR
PRODUCTS BY GEL ELECTROPHORESIS
IV.
of
the
gel.
creasing running left lane
5. Carefully remove the comb, and add additional 1× TBE buffer to just
into the far
cover and fill in wells—creating a smooth buffer surface.
6. Use a micropipet with a fresh tip to load 20 µL of pBR322/BstNI size
markers into the far left lane of the gel.
may also be used as
–
eral oil during PCR,
7. Use a micropipet with a fresh tip to add 10 µL of the undigested (U)
et tip through the
4. Use a micropipet
fresh tip(D)tosample/loading
add 10 uL of dye
the mixture
undigested
and 16 µLwith
of theadigested
into (U)
r to withdraw the
HaeIII
III. and
DIGEST
PRODUCTS
WITH
16 PCR
uLdifferent
of
the digested
(D)
sample/loading
dye
mixture
into
wells of a 2% agarose gel, according to the diagram below.
Do not pipet any
different wells of a 2% agarose gel, according to the diagram below.
om the tip before
eful not to push the
through the
ample well.
MARKER
pBR322/
BstNI
STUDENT 1
U
D
STUDENT 2
U
D
STUDENT 3
U
D
IV. ANALYZE PCR PRODUCTS BY GEL ELECTROPHORESIS
5. Run the gel at 130 V for approximately 30 minutes. Adequate
separation will have occurred when the cresol red dye front has
8. Run the gel at 130 V for approximately 30 minutes. Adequate
moved at least 50 mm from the wells.
separation will have occurred when the cresol red dye front has
moved at least 50 mm from the wells.
gel for 5–10
water leeches
ium bromide from
sing background
contrast of the
9. Stain the gel using ethidium bromide or CarolinaBLU™:
a. For ethidium bromide, stain 10–15 minutes. Decant stain back into
the storage container for reuse, and rinse the gel in tap water. Use
gloves when handling ethidium bromide solution and stained gels or
anything that has ethidium bromide on it. Ethidium bromide is a
known mutagen, and care should be taken when using and disposing
of it.
b. For CarolinaBLU™, follow directions in the Instructor Planning
section.
on, where the light
the gel, increases
contrast.
–
10. View the gel using transillumination, and photograph it using a
digital or instant camera.
PTC II - 6
Copyright © 2006, Dolan DNA Learning Center, Cold Spring Harbor Laboratory. All rights reserved.
+
6. A chemical stain that binds specifically has been mixed into the gel. This stain fluoresces
under UV light when it is bound to DNA.
Using a Single-Nucleotide Polymorphism to Predict Bitter-Tasting Ability
7. View the gel using transillumination, and photograph it using a digital or instant camera.
Typical results are shown below:
MARKER
pBR322/
BstNI
tt nontaster
U
D
TT taster
U
D
Tt taster
U
D
MARKER
100 bp
ladder
1857 bp
1058 bp
929 bp
383 bp
221 bp
177 bp
121 bp
44 bp
primer dimer
(if present)
1. Determine
yourPTC
PTC genotype.
Procedure III: Determine
your
GenotypeObserve the photograph of the
stained
gel
containing
PCR digest and
those you
fromsee
other
1. Scan across the photograph to get your
an impression
of what
in each lane. You should
students.
thelanes
photograph
with
thetosample
at the top.
Use
notice that virtually
allOrient
student
contain
one
three wells
prominent
bands.
the sample gel shown above to help interpret the band(s) in each
of the gel.the pBR322/BstNI markers on the left side of the sample gel.
2. Locate the lanelane
containing
Working froma.the
well,
locate
bands corresponding
to each
restriction
Scan
across
the the
photograph
to get an impression
of what
you see fragment: 1857
bp, 1058 bp, 929 bp,
383
bp,
and
121
bp.
The
1058-bp
and
929-bp
fragments
will be very
in each lane. You should notice that virtually all student lanes
close together or contain
may appear
a single
largebands.
band. The 121- bp band may be very faint or
one to as
three
prominent
not visible. (Alternatively, use a 100-bp ladder as shown on the right-hand side of the
b. Locate
lane containing
markers
on the left
sample gel. These
DNAthe
markers
increasethe
inpBR322/BstNI
size in 100-bp
increments
starting with the
of the
sample
fastest migratingside
band
of 100
bp.)gel. Working from the well, locate the bands
corresponding to each restriction fragment: 1857 bp, 1058 bp, 929
bp, 383 bp, the
and undigested
121 bp. The 1058-bp
and 929-bp
will bebe one
3. Locate the lane containing
PCR product
(U).fragments
There should
close
together
or may
appear
as a single
large
band. The 121prominent band very
in this
lane.
Compare
the
migration
of the
undigested
PCR product in this
bp
band
may
be
very
faint
or
not
visible.
(Alternatively,
use
a
100-bp
lane with that of the 383-bp and 121-bp bands in the pBR322/BstNI lane. Confirm that the
on the right-hand
side of
sample
as shown
undigested PCR ladder
product
corresponds
with a size
of the
about
221gel.
bp.These DNA
markers increase in size in 100-bp increments starting with the fastest
migrating
band of 100
bp.)digested PCR product (D) with the uncut control.
4. To “score” your alleles,
compare
your
c. Locate the lane containing the undigested PCR product (U). There
Record your genotype
here:
should be one
prominent band in this lane. Compare the migration
of the undigested PCR product in this lane with that of the 383-bp
Procedure IV: Determine
yourbands
PTC in
phenotype.
and 121-bp
the pBR322/BstNI lane. Confirm that the
First, place one
strip
of
control
tastecorresponds
paper in the
center
your tongue
undigested PCR product
with
a size of
of about
221 bp. for several
seconds. Note the taste. Then, remove the control paper, and place one strip of PTC taste paper
d. To
“score”for
yourseveral
alleles, compare
digested
product
(D) with
in the center of your
tongue
seconds.your
How
wouldPCR
you
describe
the taste of the PTC
You
will
be
one
of
three
genotypes:
the
uncut
control.
paper, as compared to the control: strongly bitter, weakly bitter, or no taste other than paper?
Compare thisttwith
the phenotype
you’d
expect shows
basedaon
your
genotype.
nontaster
(homozygous
recessive)
single
band
in the
same position as the uncut control.
TT taster (homozygous dominant) shows two bands of 177 bp
and 44 bp. The 177-bp band migrates just ahead of the uncut
- 7be faint. (Incomplete digestion may
control; the 44-bp PTC
band II
may
leave a small amount of uncut product at the 221-bp position, but
this band should be clearly fainter than the 177-bp band.)
GFP Transformation follow-up
In this last part of the lab, you will look at the plates you made in the GFP
Transformation lab. By now, the bacteria that can grow will have grown to colonies and those
that can produce GFP will be fluorescent under ultra-violet light.
1) What results should you expect? Discuss this as a class and fill in the table.
Plate
Growth?
None/Colonies/”Lawn”
Fluorescence
None/some colonies/all colonies/”Lawn”
+pGLO
LB/amp
+pGLO
LB/amp/ara
–pGLO
LB/amp
–pGLO
LB
2) Obtain your plates from your TA. Fill in your actual results below:
Plate
Growth?
None/Colonies/”Lawn”
+pGLO
LB/amp
+pGLO
LB/amp/ara
–pGLO
LB/amp
–pGLO
LB
3) Do they differ, why or why not?
PTC II - 8
Fluorescence
None/some colonies/all colonies/”Lawn”
Lab Report
This lab report is due as an e-mail to your TA sent during the lab period. It is a group
lab report for a group grade.
Your lab report must be in your own words.
Your lab report must consist of the answers to these questions:
1) Give one result from your plates or that of another group that differed from the expected
results.
2) Provide a plausible explanation for this difference.
PTC II - 9
PTC II - 10


