Infrared Radiation: More Than Our Eyes Can See The Visible
advertisement
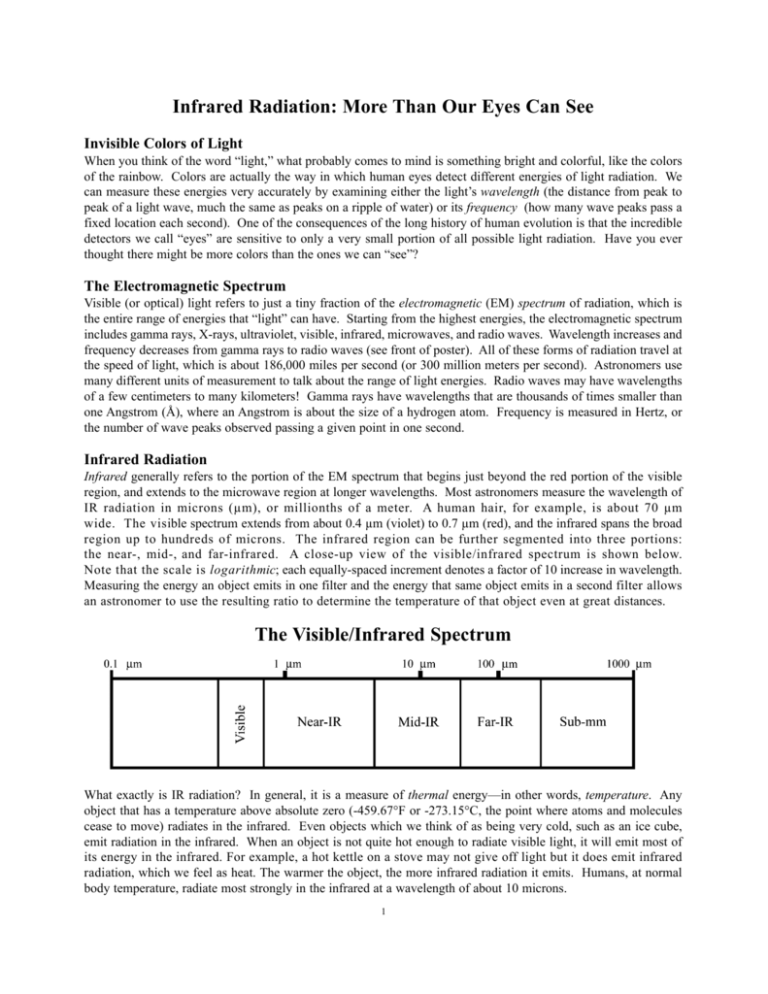
Infrared Radiation: More Than Our Eyes Can See Invisible Colors of Light When you think of the word “light,” what probably comes to mind is something bright and colorful, like the colors of the rainbow. Colors are actually the way in which human eyes detect different energies of light radiation. We can measure these energies very accurately by examining either the light’s wavelength (the distance from peak to peak of a light wave, much the same as peaks on a ripple of water) or its frequency (how many wave peaks pass a fixed location each second). One of the consequences of the long history of human evolution is that the incredible detectors we call “eyes” are sensitive to only a very small portion of all possible light radiation. Have you ever thought there might be more colors than the ones we can “see”? The Electromagnetic Spectrum Visible (or optical) light refers to just a tiny fraction of the electromagnetic (EM) spectrum of radiation, which is the entire range of energies that “light” can have. Starting from the highest energies, the electromagnetic spectrum includes gamma rays, X-rays, ultraviolet, visible, infrared, microwaves, and radio waves. Wavelength increases and frequency decreases from gamma rays to radio waves (see front of poster). All of these forms of radiation travel at the speed of light, which is about 186,000 miles per second (or 300 million meters per second). Astronomers use many different units of measurement to talk about the range of light energies. Radio waves may have wavelengths of a few centimeters to many kilometers! Gamma rays have wavelengths that are thousands of times smaller than one Angstrom (Å), where an Angstrom is about the size of a hydrogen atom. Frequency is measured in Hertz, or the number of wave peaks observed passing a given point in one second. Infrared Radiation Infrared generally refers to the portion of the EM spectrum that begins just beyond the red portion of the visible region, and extends to the microwave region at longer wavelengths. Most astronomers measure the wavelength of IR radiation in microns (µm), or millionths of a meter. A human hair, for example, is about 70 µm wide. The visible spectrum extends from about 0.4 µm (violet) to 0.7 µm (red), and the infrared spans the broad region up to hundreds of microns. The infrared region can be further segmented into three portions: the near-, mid-, and far-infrared. A close-up view of the visible/infrared spectrum is shown below. Note that the scale is logarithmic; each equally-spaced increment denotes a factor of 10 increase in wavelength. Measuring the energy an object emits in one filter and the energy that same object emits in a second filter allows an astronomer to use the resulting ratio to determine the temperature of that object even at great distances. The Visible/Infrared Spectrum What exactly is IR radiation? In general, it is a measure of thermal energy—in other words, temperature. Any object that has a temperature above absolute zero (-459.67°F or -273.15°C, the point where atoms and molecules cease to move) radiates in the infrared. Even objects which we think of as being very cold, such as an ice cube, emit radiation in the infrared. When an object is not quite hot enough to radiate visible light, it will emit most of its energy in the infrared. For example, a hot kettle on a stove may not give off light but it does emit infrared radiation, which we feel as heat. The warmer the object, the more infrared radiation it emits. Humans, at normal body temperature, radiate most strongly in the infrared at a wavelength of about 10 microns. 1 Infrared Eyes The heat that we feel from sunlight, a roaring fire, a radiator or a warm sidewalk is infrared radiation. Although our eyes cannot see it, the nerves in our skin can sense the thermal energy. The temperature-sensitive nerve endings in your skin can detect the difference between your inside body temperature and outside skin temperature. We commonly use infrared rays when we operate a television remote, and “night vision” goggles—used by the military and police—are actually made of cameras sensitive to thermal signatures in the dark of night. A revolution in technology is driving the scientific discoveries now being made in IR astronomy. Thirty years ago, the new field of IR astronomy relied on relatively crude measurements of temperatures and simple electronic recording devices to make observations. Thanks to a productive collaboration between industry and universities, we now have detector arrays capable of making infrared images, much as charge-coupled devices (CCDs) have become commonplace in optical imaging and digital photography. The genesis of this science/technology revolution was the substantial investment in infrared array technology by the military throughout the 1980s. Military interests in this technology development concentrated on high-background temperature environments and on wavelengths shorter than about 30 microns. As the accumulated technical knowledge migrated to the civilian world, scientists have redirected the focus of development towards the goal of lowbackground, high-sensitivity applications appropriate for astronomical work. An infrared image of a cat, with the warmest areas appearing the brightest A Deep Freeze Step outside on a sunny summer day, turn your face to the Sun, and you will immediately feel the warmth of our local star. Now imagine moving the Sun to a distance of hundreds of light-years (a light-year is more than 63,000 times greater than the distance between the Earth and the Sun). In essence, infrared astronomers are trying to “feel” the warmth of the stars and other objects from deep in space. Infrared astronomy is the art of measuring incredibly small values of thermal energy at incredibly large distances. In addition, there are special problems with observing in the infrared. Imagine trying to take a photograph with a camera that was glowing brightly, both inside and out. The film would be exposed by the camera’s own light, long before you ever got a chance to take a picture! Infrared astronomers face the same problem when they try to detect heat from space. At room temperature, their telescopes and instruments are shining brilliantly in the infrared. In order to record faint infrared radiation from space, astronomers must cool their science instruments to very cold temperatures. Astronomers often use liquid helium, which has a temperature of only a few degrees above absolute zero, as a cryogen (refrigerant) to cool their telescopes. The cryogen is kept in a pressurized cryostat, which is similar to a thermos bottle. In the past, space-based telescopes have surrounded the entire telescope and instruments with a gigantic cryostat to reduce stray heat radiation. Future missions (starting with SIRTF, see Panel 6) will adopt a different approach that substantially reduces the mass, and therefore cost, of infrared telescopes. These future missions will cryogenically cool the science instruments only and place the telescope well away from the thermal contamination of the Earth. In deep space, where ambient temperatures may be only 30-40 degrees above absolute zero, the next generation of IR telescopes will passively cool to near-operating temperatures. Combined with small amounts of cryogen that refrigerate the instruments, these telescopes will achieve the high sensitivities needed to detect faint thermal signals from the distant cosmos. 2 Atmospheric Transmission Apart from the local Solar System, everything we know about the Universe and its phenomena is a result of the capture and study of radiation emitted by distant objects. In a sense, astronomy is a field where only remote sensing provides the data upon which our theories and knowledge rest. After travelling vast distances through space, it is ironic that much of the information we get from the universe is absorbed by the Earth’s atmosphere. Visible light reaches the surface of the Earth, diminished—but not completely absorbed—by the gases and water vapor in our atmosphere. It is because of our atmosphere’s transmission of visible light that humans have stared and wondered about the Moon, planets, and stars since ancient times. Observations in the twentieth-century revealed naturally occurring radio emission from celestial objects, proving that radio waves are also able to penetrate the atmosphere. Closer to the visible spectrum, it is obvious that small amounts of ultraviolet light reach us (sunburns!) and some near-infrared radiation can be observed from high, dry mountaintops. However, atmospheric opacity prevents most of the other wavelengths of celestial radiation from reaching ground-based telescopes. Methods of Observing the Entire Electromagnetic Spectrum Various properties of our atmosphere account for its opacity. For example, atmospheric gases like water vapor (H 2O) and oxygen efficiently absorb radio waves with wavelengths less than about one centimeter. O ther constituent gases, including H 2O and carbon dioxide absorb most infrared radiation. Furthermore, the ionosphere (a layer of gases in the upper atmosphere ionized by solar ultraviolet rays) reflects long-wavelength radio waves. In the infrared portion of the EM spectrum, there are narrow windows through which astronomers can study the universe. Apart from the near-IR filters mentioned before, it is possible to conduct some observations around 10 and 20 microns. Beyond these wavelengths, the atmosphere remains opaque throughout the far-infrared and sub-millimeter regions, except for windows of visibility around 350 and 450 microns. To overcome these limitations, infrared astronomers have flown telescopes aboard airplanes that fly at altitudes of 40-45,000 feet, and on gondolas attached to large balloons (similar to weather balloons) that reach heights of over 100,000 feet, and on space-based satellites. 3 Why Infrared Astronomy is Important There are fundamental reasons why infrared astronomy is vital to understanding the Universe and its contents. Some of these reasons are summarized below. Dusty Galaxies A census of any galaxy, especially those characterized as spiral galaxies (like the Milky Way), reveals not only billions of luminous stars, but also an interstellar medium (ISM) filling the “empty space” between the stars. The ISM—comprised of gas atoms and molecules, in addition to solid dust particles—is a near-vacuum. In the solar neighborhood of the Galaxy, for example, there is typically only one atom of gas per cubic centimeter and a few hundred dust grains per cubic kilometer. On galactic scales, however, the effects of the gas and dust are noticeable. Centaurus A The dust grains tend to be very small, typically less than 0.1 micron in diameter, and are composed of carbon and silicate matter. These dust grains absorb and reflect the ambient ultraviolet and optical light produced by stars, producing a dimming and reddening effect that is analogous to what you might see in the Earth’s atmosphere as the Sun sets in the west. The presence of cosmic dust is best seen when conducting observations at far-infrared wavelengths. Witnessing Star Formation The ISM is a reservoir from which matter for new stars can be drawn. Some 99 percent of the ISM is either atomic gas (mostly hydrogen) or molecular gas (mostly hydrogen, water, carbon monoxide and ammonia). Molecular clouds are dense regions within the ISM where the concentrations of gas and dust are thousands of times greater than elsewhere. Molecular clouds often appear as a dark nebula against a blanket of background stars in an astronomical photograph. These clouds are actually stellar nurseries, capable of forming hundreds of stars in their cores. The Orion Nebula (see The Flame Nebula (NGC 2024) front of poster), easily visible through binoculars, is one of the nearest and richest nurseries of star formation. Because these newborn stars are swaddled in dense cocoons of gas and dust, they are often obscured from view. The clearest way of detecting young suns still embedded in their clouds is to observe in the near-infrared. Although visible light is blocked, heat from the stars can pierce the dark, murky clouds and give us a picture of how stars are born. The Distant Universe The cosmological redshift results from the expansion of the Universe and shifts any light passing through intergalactic space to longer wavelengths. High-redshift objects in the Universe are seen as they existed long ago. Most of the optical and ultraviolet radiation emitted from stars, galaxies and quasars since the beginning of time is now redshifted into the infrared. To understand how the first stars and galaxies formed in the early Universe, it is essential to probe at IR wavelengths. Galaxies in the Hubble Deep Field 4 Searching for Planets Ancient humans noted the presence of six planets (derived from the Greek “wanderers”) in our Solar System. Over the past two centuries, the list of planets methodically expanded by three, with the last—Pluto—discovered in 1930. We are now in the midst of a revolution in human understanding of our place in the cosmos. Since the mid-1990s, extrasolar planets in other solar systems are being routinely found, albeit through indirect means caused by the slight gravitational tugging of planets on their local suns. Eventually, astronomers will be able to directly image and characterize these other worlds and the best wavelengths for doing that will be in the infrared. Protoplanetary Disks: Forming Planets The first space-based infrared telescope, the InfraRed Astronomical Satellite (IRAS), measured IR radiation from nearby stars in 1983. Some stars, including Beta Pictoris, exhibited an “infrared excess,” or more IR radiation than would be expected from the star itself. When subsequent ground-based observations used a circular mask to block the intensely bright light from the star, astronomers were stunned to discover what appeared to be a flattened disk of dust seen from an edge-on perspective. Recent images have revealed warps in the inner disk, which suggests that planets have formed or are forming around this star. Beta Pictoris With better infrared detectors and increased spatial resolution, astronomers are discovering other cases of protoplanetary circumstellar disks, providing evidence that other solar systems may be common. The microscopic dust grains and residual gas surrounding newborn stars provide the ingredients for future planets. The coagulation of the grains into kilometer-sized planetesimals yields the seeds for planet formation. This process of collisions and clumping of material would eventually lead to Earth-sized protoplanets on timescales of about 100 million years. The universal laws of gravity and the similarity of chemical compositions of protoplanetary nebula, combined with the large numbers of stars in the Milky Way, lead to the conclusion that planet formation is probably a common phenomenon. Planet Hunting The direct detection of extrasolar planets is extraordinarily difficult, because of the enormous difference in luminosity between a star, which shines with its own light, and orbiting planets, which are not only much smaller and very close to the star (as seen from Earth), but shine by reflected light. The situation is akin to trying to identify a firefly buzzing around an intensely bright searchlight—from a great distance. At optical wavelengths, a star might be several billion times brighter than a large planet. However, at infrared wavelengths, where the planet emits its own thermal radiation, the contrast is only a factor of a million. Astronomers’ best hopes of imaging an extrasolar planet are to “mask” (block out) the bright star, and hope to detect a faint infrared blip off to the side—another world. One method of masking is to insert an occulting disk in the telescope, which blocks the light from the central star. This method resulted in the accompanying Hubble Space Telescope near-infrared images, where rings of dust have been discovered orbiting the star HD 141569. Future telescopes will offer the spatial resolution needed to image possible extrasolar planets directly. 5 Dust Rings around HD 141569 Infrared Observatories Some of the present and future infrared programs and missions are summarized below. For information on each of these observatories, consult the World Wide Web addresses cited. Two-Micron All-Sky Survey (2MASS) http://www.ipac.caltech.edu/2mass 2MASS is an all-sky, ground-based survey at three near-IR wavelengths, conducted with a pair of 1.3-meter diameter telescopes located in Arizona and in Chile. Survey operations began in 1997, and will be completed in 2000. The 2MASS data are publicly accessible via the Web, and will eventually include images and catalogs of about one million galaxies and 300 million stars. The 2MASS survey will yield scientific information on the structure of our Galaxy, the large-scale distribution of galaxies in the Local Universe, and identify peculiar objects —such as brown dwarfs and red quasars—for further study. Stratospheric Observatory For Infrared Astronomy (SOFIA) http://sofia.arc.nasa.gov SOFIA is an airborne observatory, with a 2.5-meter telescope housed in a 747 airplane capable of flying at altitudes of 45,000 feet. The observatory, with a design lifetime of 20 years, will make about 160 research flights annually, starting in ~2002. SOFIA will utilize interchangeable scientific instruments and will provide imaging and spectroscopic capabilities at all wavelengths extending from the optical through the submillimeter. Astronomers and educators will be onboard during these flights, most of which will use Moffett Field, California as their operations base. SOFIA will be a powerful platform for studying the interstellar medium in our Galaxy, while also studying our Solar System and other galaxies. Space Infrared Telescope Facility (SIRTF) http://sirtf.caltech.edu SIRTF is the fourth and final element in NASA's family of space-borne “Great Observatories.” SIRTF consists of a 0.85-meter telescope and three cryogenically-cooled science instruments capable of performing imaging and spectroscopy in the 3–180 micron wavelength range. The observatory is designed to operate for up to 5 years, and will be launched into an Earth-trailing solar orbit in December 2001. SIRTF will study a wide variety of astronomical phenomena, with special emphasis on investigations of brown dwarfs, protoplanetary dust disks where planets may be forming, galaxies with intense star formation, active galactic nuclei, and the distant reaches of the early Universe. Next Generation Space Telescope (NGST) http://ngst.gsfc.nasa.gov NGST will be the “next-generation” successor to the Hubble Space Telescope (HST). The observatory is presently under design, and hence some of the technical specifications remain uncertain. The core wavelength regime will be in the near-infrared, although a goal is to extend coverage into the optical and mid-infrared. An innovative and lightweight telescope mirror of 6–8 meters will have up to 10 times the collecting area of HST, providing superb imaging and spectroscopic capabilities. The observatory will operate for 5–10 years, and be launched into deep space in about ~2009. NGST will reach back to the high-redshift Universe to detect and study the first galaxies and stars in the process of formation. Terrestrial Planet Finder (TPF) http://tpf.jpl.nasa.gov TPF is a space-borne infrared interferometer designed to detect and characterize Earth-size planets orbiting stars within 45 light-years. In a 5-year mission starting in about ~2011, TPF will look for the atmospheric signatures (such as water, carbon dioxide, and ozone) of habitable—or even inhabited—planets. TPF will consist of four cooled in frare d t e l e s c o p e s , e a c h o f 3 –4 m eter s in diam eter. By com bining the signals f r o m each o f th e i n d i v i d u a l t e l escopes, separated by up to a kilometer, TPF will provide the unprecedented spatial resolution needed to directly detect terrestrial planets around other stars. 6 Herschel Infrared Experiment - I PURPOSE/OBJECTIVE: To perform a version of the experiment of 1800, in which a form of radiation other than visible light was discovered by the famous astronomer Sir Frederick William Herschel. BACKGROUND: Herschel discovered the existence of infrared light by passing sunlight through a glass prism in an experiment similar to the one we describe here. As sunlight passed through the prism, it was dispersed into a rainbow of colors called a spectrum. A spectrum contains all of the visible colors that make up sunlight. Herschel was interested in measuring the amount of heat in each color and used thermometers with blackened bulbs to measure the various color temperatures. He noticed that the temperature increased from the blue to the red part of the visible spectrum. He then placed a thermometer just beyond the red part of the spectrum in a region where there was no visible light -- and found that the temperature was even higher! Herschel realized that there must be another type of light beyond the red, which we cannot see. This type of light became known as infrared. Infra is derived from the Latin word for "below." Although the procedure for this activity is slightly different than Herschel's original experiment, you should obtain similar results. MATERIALS: One glass prism (plastic prisms do not work well for this experiment), three alcohol thermometers, black paint or a permanent black marker, scissors or a prism stand, cardboard box (a photocopier paper box works fine), one blank sheet of white paper. PREPARATION: You will need to blacken the thermometer bulbs to make the experiment work effectively. One way to do this is to paint the bulbs with black paint, covering each bulb with about the same amount of paint. Alternatively, you can also blacken the bulbs using a permanent black marker. (Note: the painted bulbs tend to produce better results.) The bulbs of the thermometers are blackened in order to absorb heat better. After the paint or marker ink has completely dried on the thermometer bulbs, tape the thermometers together such that the temperature scales line up as in Figure 1. PROCEDURE: The experiment should be conducted outdoors on a sunny day. Variable cloud conditions, such as patchy cumulus clouds or heavy haze will diminish your results. The setup for the experiment is depicted in Figure 2. Begin by placing the white sheet of paper flat in the bottom of Figure 1 the cardboard box. The next step requires you to carefully attach the glass prism near the top (Sun-facing) edge of the box. If you do not have a prism stand (available from science supply stores), the easiest way to mount the prism is to cut out an area from the top edge of the box. The cutout notch should hold the prism snugly, while permitting its rotation about the prism's long axis (as shown in Figure 3). That is, the vertical "side" cuts should be spaced slightly closer than the length of the prism, and the "bottom" cut should be located slightly deeper than the width of the prism. Next, slide the prism into the notch cut from the box and rotate the prism until the widest possible spectrum appears on a shaded portion of the white sheet of paper at the bottom of the box. The Sun-facing side of the box may have to be elevated (tilted up) to produce a sufficiently wide spectrum. After the prism is secured in the notch, place the thermometers in the shade and record the ambient air temperature. Then place the thermometers in the spectrum such that one of the bulbs is in the blue region, another is in the yellow region, and the third is just beyond the (visible) red region (as in Figure 1). National Aeronautics and Space Administration Jet Propulsion Laboratory California Institute of Technology Pasadena, California 7 Herschel Infrared Experiment - II Figure 2 Figure 3 It will take about five minutes for the temperatures to reach their final values. Record the temperatures in each of the three regions of the spectrum: blue, yellow, and "just beyond" the red. Do not remove the thermometers from the spectrum or block the spectrum while reading the temperatures. Data/Observations: Temperature in the shade Thermometer #1 Thermometer #2 Thermometer #3 Temperature in the spectrum Thermometer #1 (blue) Thermometer #2 (yellow) Thermometer #3 (just past red) After 1 minute After 2 minutes After 3 minutes After 4 minutes After 5 minutes NOTE: Depending on the orientation of your prism, the color red could be at either end of the spectrum. Adjust the positions of your thermometers accordingly. QUESTIONS: What did you notice about your temperature readings? Did you see any trends? Where was the highest temperature? What do you think exists just beyond the red part of the spectrum? Discuss any other observations or problems. REMARKS TO THE TEACHER: Have the students answer the above questions. The temperatures of the colors should increase from the blue to red part of the spectrum. The highest temperature should be just beyond the red portion of the visible light spectrum. This is the infrared region of the spectrum. Herschel's experiment was important not only because it led to the discovery of infrared light, but also because it was the first time that it was shown that there were forms of light that we cannot see with our eyes. As we now know, there are many other types of electromagnetic radiation ("light") that the human eye cannot see (including X-rays, ultraviolet rays and radio waves). You can also have the students measure the temperature of other areas of the spectrum including the area just beyond the visible blue. Also, try the experiment during different times of the day; the temperature differences between the colors may change, but the relative comparisons will remain valid. 8 Education Resources World Wide Web (WWW) • • • • • • • • • • • • • • • • • • Infrared Astronomy Tutorial (IPAC) Herschel Infrared Experiment(IPAC) EM Spectrum (Imagine the Universe) Light (Center for EUV Astrophysics) Infrared Light (Newton’s Apple Online) Infrared Technology (SIRTF) Space Telescope Science Institute (STScI) NASA’s Origins Program Astronomy Picture of the Day (NASA-GSFC) Amazing Space! (STScI) Windows to the Universe (Univ. Michigan) Remote Sensing (The Observatorium) Exploring Planets in the Classroom NASA Spacelink American Astronomical Society Astronomical Society of the Pacific Challenger Center Telescopes in Education www.ipac.caltech.edu sirtf.caltech.edu/Education/Herschel/herschel.html imagine.gsfc.nasa.gov/docs/introduction/emspectrum.html cse.ssl.berkeley.edu/light/light_tour.html www.tpt.org/newtons/11/infrared.html www.ipac.caltech.edu oposite.stsci.edu/pubinfo eis.jpl.nasa.gov/origins/index.html antwrp.gsfc.nasa.gov/apod/archivepix.html amazing-space.stsci.edu www.windows.umich.edu observe.ivv.nasa.gov/nasa/education/reference/main.html www.soest.hawaii.edu/spacegrant/class_acts spacelink.nasa.gov/index.html www.aas.org/~education/index1.html www.aspsky.org/education.html www.challenger.org/eduprog.html tie.jpl.nasa.gov/tie/index.html Educator’s Background Materials Universe in the Classroom. Free quarterly newsletter for grades 4–12 teachers. Write to the Astronomical Society of the Pacific, 390 Ashton Ave. San Francisco, CA 94112, or subscribe via http://www.aspsky.org. Catalog of educational materials from the ASP available at the same address. NASA CORE catalog. Hundreds of low-cost slides, videos, and other NASA educational materials. Write to Lorain County JVS-NASA CORE, 15181 Route 58 South, Oberlin, OH 44074. http://core.nasa.gov Related Links and Resources Astronomy Education: A Selective Bibliography (by A. Fraknoi) http://www.aspsky.org/education/educ_bib.html National Astronomy Education Projects: A Catalog (by A. Fraknoi, S. Lalor, N. Taddune). http://www.aspsky.org/education/educ_bib.html University of Texas McDonald Observatory: posters, activities, CDs of the Star Date radio program, and fact sheets. Contact at RLM 15.308, Univ. of Texas, Austin, TX, 78712. http://stardate.utexas.edu Credits Graphics design (front) by Michelle Thaller, Michael Bicay, Robin Dumas, and Charles Bluehawk. Text by Michael Bicay, Michelle Thaller, Linda Hermans, Mike Bennett, Schuyler Van Dyk, and Richard Yessayian. Photo Credits Front: Planets: Space Telescope Science Institute (STScI), McDonald Observatory. Star Birth: 2-Micron All-Sky Survey (2MASS), Infrared Astronomical Satellite, Subaru/National Astronomical Observatory of Japan. The Milky Way: 2MASS, Cosmic Background Explorer, European Southern Observatory. Colliding Galaxies: STScI, Infrared Space Observatory. Back: SE-IR Corp., National Aeronautics and Space Administration, National Optical Astronomical Observatories, 2MASS, STScI, European Southern Observatory. This poster is a collaborative production between the SIRTF/SSC and the SOFIA Offices of Education and Public Outreach. For additional copies, or information, contact sirtf@ipac.caltech.edu. 9
