Test 3 Information
advertisement
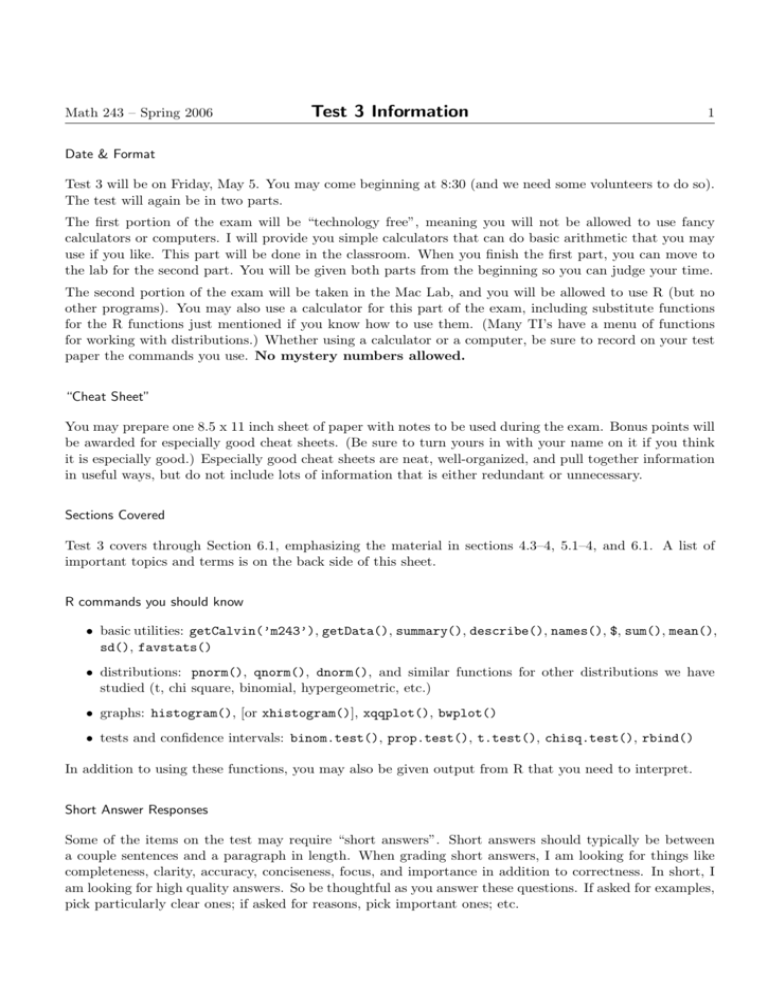
Math 243 – Spring 2006 Test 3 Information 1 Date & Format Test 3 will be on Friday, May 5. You may come beginning at 8:30 (and we need some volunteers to do so). The test will again be in two parts. The first portion of the exam will be “technology free”, meaning you will not be allowed to use fancy calculators or computers. I will provide you simple calculators that can do basic arithmetic that you may use if you like. This part will be done in the classroom. When you finish the first part, you can move to the lab for the second part. You will be given both parts from the beginning so you can judge your time. The second portion of the exam will be taken in the Mac Lab, and you will be allowed to use R (but no other programs). You may also use a calculator for this part of the exam, including substitute functions for the R functions just mentioned if you know how to use them. (Many TI’s have a menu of functions for working with distributions.) Whether using a calculator or a computer, be sure to record on your test paper the commands you use. No mystery numbers allowed. “Cheat Sheet” You may prepare one 8.5 x 11 inch sheet of paper with notes to be used during the exam. Bonus points will be awarded for especially good cheat sheets. (Be sure to turn yours in with your name on it if you think it is especially good.) Especially good cheat sheets are neat, well-organized, and pull together information in useful ways, but do not include lots of information that is either redundant or unnecessary. Sections Covered Test 3 covers through Section 6.1, emphasizing the material in sections 4.3–4, 5.1–4, and 6.1. A list of important topics and terms is on the back side of this sheet. R commands you should know • basic utilities: getCalvin(’m243’), getData(), summary(), describe(), names(), $, sum(), mean(), sd(), favstats() • distributions: pnorm(), qnorm(), dnorm(), and similar functions for other distributions we have studied (t, chi square, binomial, hypergeometric, etc.) • graphs: histogram(), [or xhistogram()], xqqplot(), bwplot() • tests and confidence intervals: binom.test(), prop.test(), t.test(), chisq.test(), rbind() In addition to using these functions, you may also be given output from R that you need to interpret. Short Answer Responses Some of the items on the test may require “short answers”. Short answers should typically be between a couple sentences and a paragraph in length. When grading short answers, I am looking for things like completeness, clarity, accuracy, conciseness, focus, and importance in addition to correctness. In short, I am looking for high quality answers. So be thoughtful as you answer these questions. If asked for examples, pick particularly clear ones; if asked for reasons, pick important ones; etc. Math 243 – Spring 2006 Test 3 Information 2 Important Topics and Terms 1. Random Variables and Probability: • key terms: outcome, event, sample space, probability distribution (pdf), cumulative probability (cdf), probability rules (sum rule, complement rule, total probability rule, product rule)equally likely, mutually exclusive, independent events, expected value, binomial coefficients ( nk ) • distinction between discrete and continuous random variables • pdf’s and cdf’s (how to use these if given a formula and how to work with them in R) • calculation of expected value and standard deviation of a random variable (including rules for sums and differences) • important example distributions: hypergeometric distribution, binomial distribution, discrete uniform (equally likely model), normal distribution, exponential distribution 2. Sampling and Sampling Distributions • parameters and statistics • simple random sample (what it is and why it is important) • what a sampling distribution is • Central Limit Theorem (CLT) 3. Hypothesis Testing • stating null and alternative hypotheses carefully (using words and symbols) • how to conduct a test and interpret the results (outline of steps common to all hypothesis tests) • carefully explaining what a p-value means • empirical, theoretical, and approximate p-values • type I and type II error, power • how and when to perform the various tests we have seen so far (1-proportion, 2-proportion, 1-sample t, 2-sample t, paired t, chi square) • technical conditions involved 4. Confidence Intervals • how to construct confidence intervals for proportions and means (1-sample, 2-sample and paired designs), confidence interval for an odds ratio • what the confidence level measures • relationship between confidence intervals and hypothesis tests 5. Design issues • difference between 2-sample and paired designs • what tests are appropriate for what situations, what kinds of data are required • role of randomization • observational studies, experiments, case-control, cohort studies, prospective/retrospective studies, etc.
