Portfolio Series Income Fund
advertisement
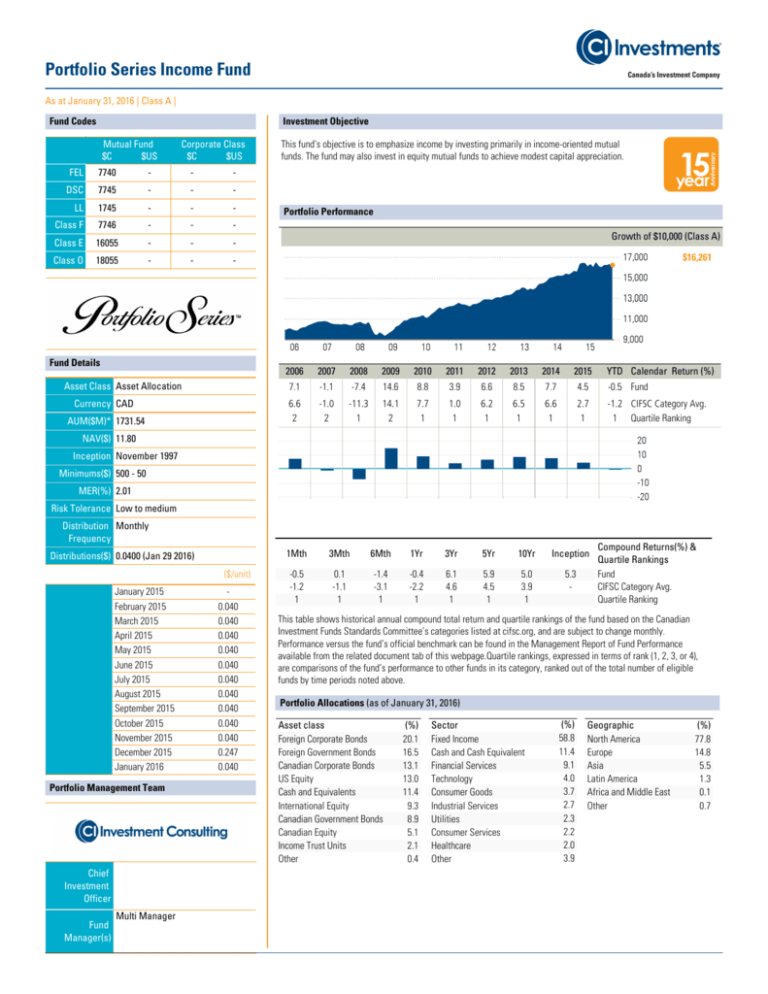
Portfolio Series Income Fund As at January 31, 2016 | Class A | Investment Objective Fund Codes Mutual Fund $C $US Corporate Class $C $US FEL 7740 - - - DSC 7745 - - - LL 1745 - - - Class F 7746 - - - Class E 16055 - - - Class O 18055 - - - Fund Details Asset Class Asset Allocation Currency CAD AUM($M)* 1731.54 This fund's objective is to emphasize income by investing primarily in income-oriented mutual funds. The fund may also invest in equity mutual funds to achieve modest capital appreciation. Portfolio Performance Growth of $10,000 (Class A) $16,261 2006 2007 2008 2009 2010 2011 2012 2013 2014 2015 7.1 -1.1 -7.4 14.6 8.8 3.9 6.6 8.5 7.7 4.5 YTD Calendar Return (%) -0.5 Fund 6.6 2 -1.0 2 -11.3 1 14.1 2 7.7 1 1.0 1 6.2 1 6.5 1 6.6 1 2.7 1 -1.2 CIFSC Category Avg. 1 Quartile Ranking NAV($) 11.80 Inception November 1997 Minimums($) 500 - 50 MER(%) 2.01 Risk Tolerance Low to medium Distribution Monthly Frequency Distributions($) 0.0400 (Jan 29 2016) ($/unit) January 2015 February 2015 March 2015 April 2015 May 2015 June 2015 July 2015 August 2015 September 2015 October 2015 November 2015 December 2015 January 2016 Portfolio Management Team Chief Investment Officer Multi Manager Fund Manager(s) 0.040 0.040 0.040 0.040 0.040 0.040 0.040 0.040 0.040 0.040 0.247 0.040 1Mth 3Mth 6Mth 1Yr 3Yr 5Yr 10Yr Inception -0.5 -1.2 1 0.1 -1.1 1 -1.4 -3.1 1 -0.4 -2.2 1 6.1 4.6 1 5.9 4.5 1 5.0 3.9 1 5.3 - Compound Returns(%) & Quartile Rankings Fund CIFSC Category Avg. Quartile Ranking This table shows historical annual compound total return and quartile rankings of the fund based on the Canadian Investment Funds Standards Committee’s categories listed at cifsc.org, and are subject to change monthly. Performance versus the fund’s official benchmark can be found in the Management Report of Fund Performance available from the related document tab of this webpage.Quartile rankings, expressed in terms of rank (1, 2, 3, or 4), are comparisons of the fund’s performance to other funds in its category, ranked out of the total number of eligible funds by time periods noted above. Portfolio Allocations (as of January 31, 2016) Asset class Foreign Corporate Bonds Foreign Government Bonds Canadian Corporate Bonds US Equity Cash and Equivalents International Equity Canadian Government Bonds Canadian Equity Income Trust Units Other (%) 20.1 16.5 13.1 13.0 11.4 9.3 8.9 5.1 2.1 0.4 Sector Fixed Income Cash and Cash Equivalent Financial Services Technology Consumer Goods Industrial Services Utilities Consumer Services Healthcare Other (%) 58.8 11.4 9.1 4.0 3.7 2.7 2.3 2.2 2.0 3.9 Geographic North America Europe Asia Latin America Africa and Middle East Other (%) 77.8 14.8 5.5 1.3 0.1 0.7 Portfolio Series Income Fund As at January 31, 2016 | Class A | Top Holdings (as of January 31, 2016) Sector CI Signature Global Bond Fund Class I Mutual Fund 19.23 (%) CI Signature Corporate Bond Fund Class I Mutual Fund 15.26 CI Signature Canadian Bond Fund Class I Mutual Fund 10.55 CI Global High Dividend Advantage Fund Class A Mutual Fund 8.03 CI Signature Diversified Yield II Fund I Mutual Fund 6.14 Cambridge Global Dividend Fund Class I Mutual Fund 5.96 CI Cambridge Income Corporate Class A Mutual Fund 5.88 CI Signature Income & Growth Fund Class I Mutual Fund 4.44 CI Signature High Income Fund Class I Mutual Fund 4.29 CI Signature Global Dividend Corporate Class A Mutual Fund 3.83 Lawrence Park Strategic Income Fund Class I Mutual Fund 3.29 CI Investment Grade Bond Fund Class A Mutual Fund 3.24 CI Signature Dividend Corporate Class A Mutual Fund 2.91 Signature Tactical Bond Pool Class I Mutual Fund 1.99 CI U.S. Income US$ Pool Class A Mutual Fund 0.62 Fund of Funds Holdings (as of January 31, 2016) Sector (%) Cambridge Income Trust Class C Mutual Fund 5.83 CI Signature Global Dividend Fund Class A Mutual Fund 3.81 United States Treasury Note/Bond 2.13% 31-Dec-2022 Fixed Income 1.49 France Government Bond OAT 1.00% 25-Nov-2025 Fixed Income 0.93 United States Treasury 3.13 % 15-May-2021 Fixed Income 0.90 Japan Government 1.50 % 20-Jun-2034 Fixed Income 0.84 United States Treasury 1.75 % 28-Feb-2022 Fixed Income 0.83 France Government Bond OAT 3.25% 25-May-2045 Fixed Income 0.81 United States Treasury 1.63 % 31-Aug-2019 Fixed Income 0.79 Italy Government 1.05 % 01-Dec-2019 Fixed Income 0.70 United States Treasury 3.00 % 15-May-2045 Fixed Income 0.68 Quebec Province 4.50 % 01-Dec-2019 Fixed Income 0.64 Japan Government 0.10 % 20-Mar-2020 Fixed Income 0.64 Spain Government Bond 1.40% 31-Jan-2020 Fixed Income 0.60 Canada Government 3.50 % 01-Dec-2045 Fixed Income 0.54 Portfolio Management Team Profile Multi Manager CI Investment Consulting is a portfolio management team responsible for monitoring all CI funds. Its mandate centres on portfolio manager selection and monitoring, performance analysis and risk management. The team, led by Portfolio Manager Alfred Lam, also has direct oversight of more than $20 billion in assets in CI’s managed solutions. About CI Investments #)Ï)NVESTMENTSÏ)NCÏISÏAÏLEADINGÏ#ANADIANÓOWNEDÏ investment management company. Our philosophy is based on choice giving you the power to choose the investments that meet your individual needs. We offer an extraordinary selection of funds and leading portfolio management teams whose investment expertise is among the best in the world. We market our funds through a network of more than 40,000 financial advisors because we think you are most successful when you follow a sound financial plan developed with the assistance of a qualified advisor. CI is a subsidiary of CI Financial Corp., which is listed on the Toronto Stock Exchange under the symbol CIX. Commissions, trailing commissions, management fees and expenses all may be associated with mutual fund investments. Please read the prospectus before investing. The indicated rates of return are the historical annual compounded total including changes in unit value and reinvestment of all distributions and do not take into account sales, redemption, distribution or optional charges or income taxes payable by any securityholder that would have reduced returns. Mutual funds are not guaranteed, their values change frequently and past performance may not be repeated. Please refer to the Legal section of www.ci.com for additional information.*Assets under management are as at the end of the most recent quarter ending March 31, June 30, September 30 or December 31.
