Insurance Sector Snapshot
advertisement
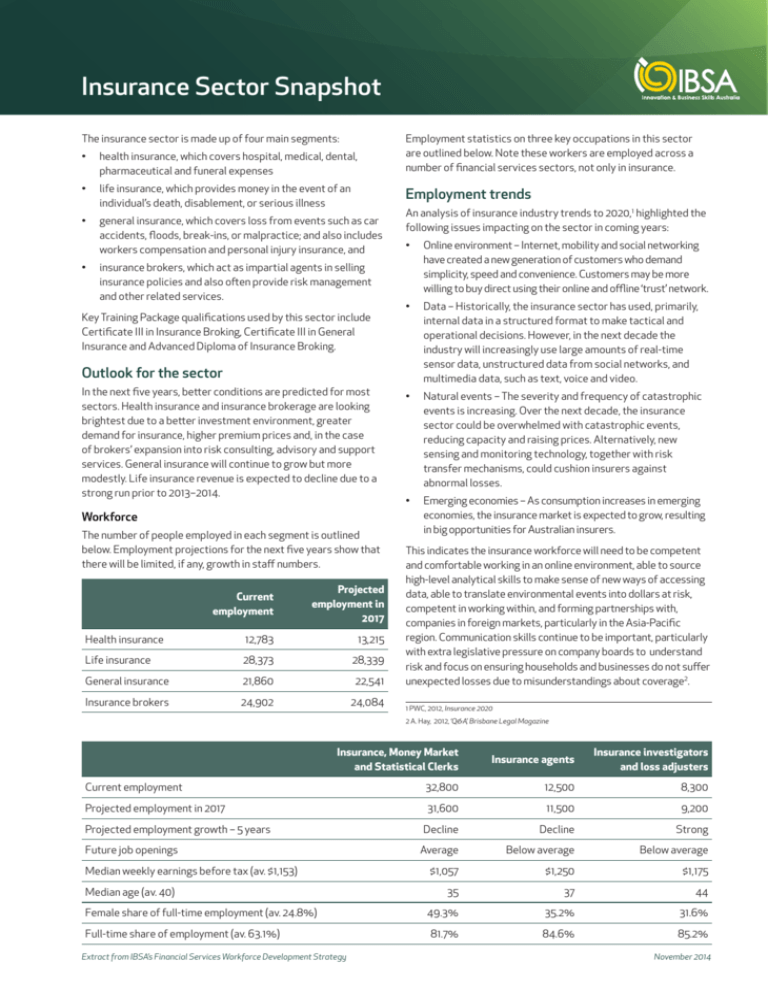
Insurance Sector Snapshot The insurance sector is made up of four main segments: Employment statistics on three key occupations in this sector are outlined below. Note these workers are employed across a number of financial services sectors, not only in insurance. • health insurance, which covers hospital, medical, dental, pharmaceutical and funeral expenses • life insurance, which provides money in the event of an individual’s death, disablement, or serious illness • general insurance, which covers loss from events such as car accidents, floods, break-ins, or malpractice; and also includes workers compensation and personal injury insurance, and • Employment trends insurance brokers, which act as impartial agents in selling insurance policies and also often provide risk management and other related services. Key Training Package qualifications used by this sector include Certificate III in Insurance Broking, Certificate III in General Insurance and Advanced Diploma of Insurance Broking. An analysis of insurance industry trends to 2020,1 highlighted the following issues impacting on the sector in coming years: • Online environment – Internet, mobility and social networking have created a new generation of customers who demand simplicity, speed and convenience. Customers may be more willing to buy direct using their online and offline ‘trust’ network. • Data – Historically, the insurance sector has used, primarily, internal data in a structured format to make tactical and operational decisions. However, in the next decade the industry will increasingly use large amounts of real-time sensor data, unstructured data from social networks, and multimedia data, such as text, voice and video. • Natural events – The severity and frequency of catastrophic events is increasing. Over the next decade, the insurance sector could be overwhelmed with catastrophic events, reducing capacity and raising prices. Alternatively, new sensing and monitoring technology, together with risk transfer mechanisms, could cushion insurers against abnormal losses. • Emerging economies – As consumption increases in emerging economies, the insurance market is expected to grow, resulting in big opportunities for Australian insurers. Outlook for the sector In the next five years, better conditions are predicted for most sectors. Health insurance and insurance brokerage are looking brightest due to a better investment environment, greater demand for insurance, higher premium prices and, in the case of brokers’ expansion into risk consulting, advisory and support services. General insurance will continue to grow but more modestly. Life insurance revenue is expected to decline due to a strong run prior to 2013–2014. Workforce The number of people employed in each segment is outlined below. Employment projections for the next five years show that there will be limited, if any, growth in staff numbers. Current employment Projected employment in 2017 Health insurance 12,783 13,215 Life insurance 28,373 28,339 General insurance 21,860 22,541 Insurance brokers 24,902 24,084 This indicates the insurance workforce will need to be competent and comfortable working in an online environment, able to source high-level analytical skills to make sense of new ways of accessing data, able to translate environmental events into dollars at risk, competent in working within, and forming partnerships with, companies in foreign markets, particularly in the Asia-Pacific region. Communication skills continue to be important, particularly with extra legislative pressure on company boards to understand risk and focus on ensuring households and businesses do not suffer unexpected losses due to misunderstandings about coverage2. 1 PWC, 2012, Insurance 2020 2 A. Hay, 2012, ‘Q&A’, Brisbane Legal Magazine Insurance, Money Market and Statistical Clerks Insurance agents Insurance investigators and loss adjusters Current employment 32,800 12,500 8,300 Projected employment in 2017 31,600 11,500 9,200 Projected employment growth – 5 years Decline Decline Strong Future job openings Average Below average Below average $1,057 $1,250 $1,175 35 37 44 49.3% 35.2% 31.6% 81.7% 84.6% 85.2% Median weekly earnings before tax (av. $1,153) Median age (av. 40) Female share of full-time employment (av. 24.8%) Full-time share of employment (av. 63.1%) Extract from IBSA’s Financial Services Workforce Development Strategy November 2014

