HKFS Investment Advisory Committee Meeting Summary March 30
advertisement
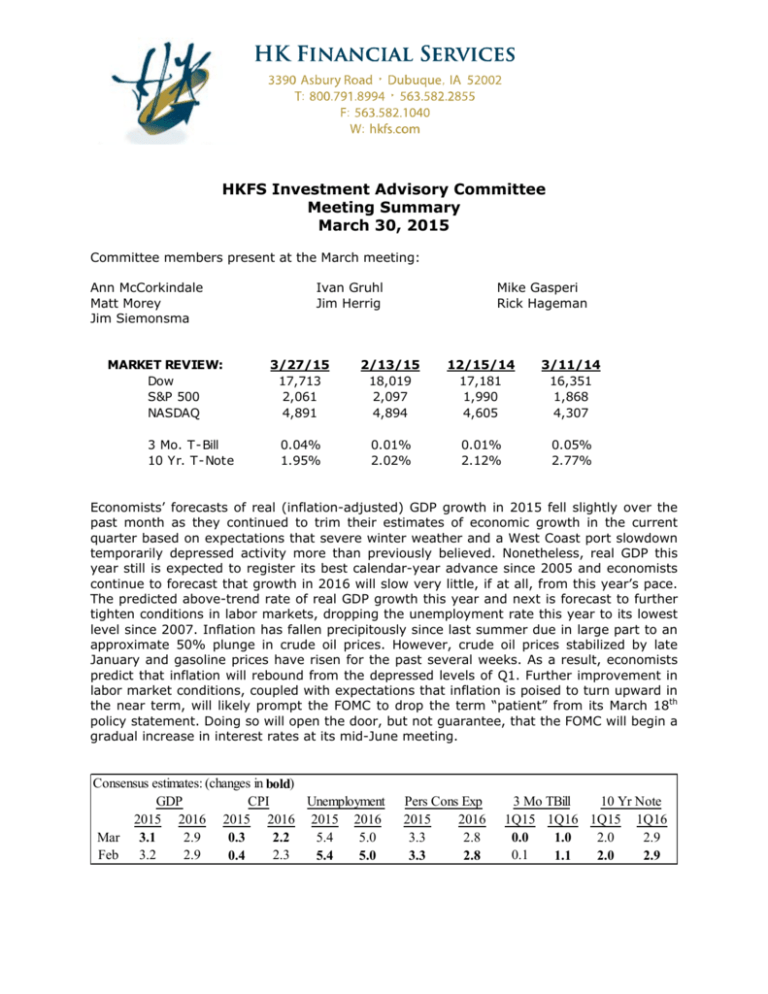
HKFS Investment Advisory Committee Meeting Summary March 30, 2015 Committee members present at the March meeting: Ann McCorkindale Matt Morey Jim Siemonsma MARKET REVIEW: Dow S&P 500 NASDAQ 3 Mo. T-Bill 10 Yr. T-Note Ivan Gruhl Jim Herrig Mike Gasperi Rick Hageman 3/27/15 17,713 2,061 4,891 2/13/15 18,019 2,097 4,894 12/15/14 17,181 1,990 4,605 3/11/14 16,351 1,868 4,307 0.04% 1.95% 0.01% 2.02% 0.01% 2.12% 0.05% 2.77% Economists’ forecasts of real (inflation-adjusted) GDP growth in 2015 fell slightly over the past month as they continued to trim their estimates of economic growth in the current quarter based on expectations that severe winter weather and a West Coast port slowdown temporarily depressed activity more than previously believed. Nonetheless, real GDP this year still is expected to register its best calendar-year advance since 2005 and economists continue to forecast that growth in 2016 will slow very little, if at all, from this year’s pace. The predicted above-trend rate of real GDP growth this year and next is forecast to further tighten conditions in labor markets, dropping the unemployment rate this year to its lowest level since 2007. Inflation has fallen precipitously since last summer due in large part to an approximate 50% plunge in crude oil prices. However, crude oil prices stabilized by late January and gasoline prices have risen for the past several weeks. As a result, economists predict that inflation will rebound from the depressed levels of Q1. Further improvement in labor market conditions, coupled with expectations that inflation is poised to turn upward in the near term, will likely prompt the FOMC to drop the term “patient” from its March 18th policy statement. Doing so will open the door, but not guarantee, that the FOMC will begin a gradual increase in interest rates at its mid-June meeting. Consensus estimates: (changes in bold) GDP CPI Unemployment 2015 2016 2015 2016 2015 2016 Mar 3.1 2.9 5.4 5.0 0.3 2.2 Feb 3.2 2.9 2.3 0.4 5.4 5.0 Pers Cons Exp 2015 2016 3.3 2.8 3.3 2.8 10 Yr Note 3 Mo TBill 1Q15 1Q16 1Q15 1Q16 2.0 2.9 0.0 1.0 0.1 1.1 2.0 2.9 Internal Use Only, Not to be Distributed to the Public STOCK MARKET: In February the Dow Jones Industrial Average was up 6.01%, the NASDAQ was gained 7.25%, and the S&P 500 was up 5.75%. Overseas, the MSCI ACWI Ex USA was up 5.35%; while EAFE was up 5.98% and emerging markets were up 3.10%. The HKFS/Schwab Growth Model grew 4.86% in February, and the Equity Income Model was up 3.75%, both underperforming the 70% S&P 500 / 30% MSCI ACWI Ex-US custom benchmark gain of 5.63%. Over the last twelve months the Growth Model was up 11.72% and the Equity Income Model is up 9.93% vs. the 70/30 custom benchmark gain of 11.01%. Over the past 12 months attribution analysis indicates our style weighting decisions resulted in a -0.05% detraction (with large growth adding the most return while international detracted the most) to the growth model. Our active managers added 1.42% to performance (with large growth ETF and international developed value managers adding the most and large value ETF detracting the most). Five of the thirteen funds in the portfolio outperformed their respective benchmarks in February. The highest performing funds on an absolute basis for the month were Janus Venture at 8.04% and Schwab U.S. Large Growth ETF at 6.58%. An actual HKFS/SEI Growth Model Portfolio grew 5.35% in February. On the SEI platform the Small Cap Growth fund had the highest absolute performance with a gain of 7.59%. Over the last twelve months the model was up 8.95%. An actual HKFS/ETF Growth Model Portfolio grew 4.77% in February. On the ETF model platform, the Schwab U.S. Large Growth ETF had the highest absolute performance at 6.58%. Over the last twelve months the model was up 11.14%. Monthly Fund Review: Schwab Large Value ETF- the current offering- SCHV, has begun to underperform the Russell 1000 Value benchmark, but with reason. The Fund does not mimic that benchmark, but rather the Dow Jones S&P Large Value Index. While SCHV is appearing to underperform against our Russell benchmark, it is not on ‘watch’ status. It has stayed in the top 50% of its Large Value peers for the last 1, 3 & 5 year periods. The Committee believes a passive fund in this space is rational, however, fund availability with no transaction fees are limited. Schwab has presented information comparing and contrasting fundamentally weighted index funds vs. market-weight index funds. The Committee will review this information and move forward with a change if warranted. In addition, the Committee is reviewing changes to the Equity Income domestic/foreign allocation, and will research adding an additional developed market manager. The Investment Advisory Committee reviewed model growth funds currently on ‘watch’ statusThe following stock funds are on ‘watch list’ status: Name Lazard Emerging Markets Goldman Sachs Growth Opp. Reason Std. Deviation, 12-mo Return, Perf Rank Mgmt Change HKFS Investment Advisory Committee Summary, March 30th, 2015 Current Status Hold Hold 2 Internal Use Only, Not to be Distributed to the Public Lord Abbett Intl Dividend Janus Venture Std. Deviation, 12-mo Return Mgmt Change Hold Hold MUTUAL FUND WATCH LISTS: The following criteria set by the Investment Advisory Committee places funds used on the Schwab platform on ‘watch list’ status: Significant news event concerning fund family, fund or manager (i.e.: scandal, buyout, etc.) Change in fund management that affects over 33% of the management team Change in fund investment style at the prospectus level % Rank Category over last 12 month and 3 year period at or above 50% (i.e.: not performing in at least top 50% of peer fund group) Combination of 3-yr standard deviation at 10% above benchmark and 12-month return below benchmark Additional items at discretion of Committee (SEI Fund managers are monitored by SEI Trust) Lazard Emerging Markets Fund: (added to watchlist 1/21/15) The Lazard Emerging Markets Fund was added to the watch list due to the combination of 3yr standard deviation at 10% above benchmark and 12-month return below benchmark. LZOEX gained 3.33% vs. 5.01% for the MSCI EM benchmark over the past twelve months. The fund’s standard deviation is 15.58 vs. 13.44 MSCI EM. Additionally, the 3-month and 3yr peer rankings have fallen below 50% (data through 2/28/15). In 2014, LZOEX was hurt by its allocation to Russian stocks, and even adding to some of them. Sberbank began 2014 as the fund’s top holding, with 3.6% of assets, and Gazprom had 1.9%. Both stocks were slammed, as were the fund’s other Russian holdings, with the ruble’s plunge adding to the pain. Portfolio manager James Donald bought even more- he says that even with their substantial risks, their dominant market positions and deeply discounted prices make them appealing long-term holdings. Considering how hard that market and currency were hit, the fund’s showing- it’s 4% loss was just 1% below the category average. LZOEX uses a relative value approach, shying away from a strict deep-value style, often ending up in the blended category. The fund’s country weightings often differ markedly from those of the index. Most notably, the manager was long reluctant to buy stocks in China, considering them much more expensive that comparable choices elsewhere. The fund had almost no exposure in China until 2012 and was still significantly underweight at 12% by year-end 2013. Conversely, it had a relatively high stake in South Africa, but was about market weight by 2014. Turnover is very low, falling from about 50% prior to 2010 to 16% in 2013. The category average is about 75%. Stock ownership is capped at 5% of assets, and less for smallercaps. The fund does not hedge its currency exposure. Recommendation: Hold and continue to monitor relative performance. Lord Abbett Int’l Dividend: (added to watchlist 2/18/15) HKFS Investment Advisory Committee Summary, March 30th, 2015 3 Internal Use Only, Not to be Distributed to the Public The Lord Abbett Int’l Dividend Fund was added to the watch list due to performance falling to the bottom half of its peers over the past 12-month and 3-year periods. LIDAX lost 1.02% over the past twelve months (peer rank of 26) and has returned 5.88% annualized over the past three years (peer rank of 84) (data through 2/28/15). The fund has underperformed its benchmark (MSCI ACWI Ex-USA) for the past 3 and 12 month, and 3 & 5 year periods. Stock selection within the industrials and consumer discretionary sectors contributed to relative performance during 4Q14. Additionally, the Fund benefitted from an underweight position in the materials sector. However, stock selection within the healthcare and consumer staple sectors detracted from last quarter’s performance. Shares of Sanofi, a globally diversified healthcare company, fell after weak Q3 results due to lower revenues and contracting margins. Additionally, Swiss Roche Holding Ltd., a pharma and diagnostics company, struggled following negative news on in product pipeline. Recommendation: Hold and continue to monitor relative performance. Goldman Sachs Growth Opportunities: (added to watchlist 2/18/15) The Goldman Sachs Growth Opportunities Fund was added to the watch list due to another management change. GGOAX has gained 10.38% over the past twelve months (peer rank of 32) and has returned 16.48% annualized over the past three years (peer rank of 35) (data through 2/28/15). The fund has underperformed its benchmark- Russell Midcap Growth, during those periods. Craig Glassner, managing director and portfolio manager on the Growth Equity team, is leaving the firm. Glassner shared PM responsibility for GGOAX with Steve Barry and Ashley Woodruff. Glassner’s research responsibilities for the healthcare sector will be absorbed by Tim Leahy and Anant Padmanabhan. Leahy has 16 years of investment experience, 10 of which are with the Growth team. Padmanabhan has 10 years of research experience. Both are members of the healthcare research team. Manager Steve Barry has been lead manager of this fund since 1999. Steve is also CIO of the fundamental equity team at GSAM, overseeing the firm’s U.S. and global equity teams, as well as CIO of the U.S. growth equity group under that umbrella, and a manager on eight other strategies within that group. The Growth Equity team consists of 14 investment and three risk professionals, with the senior leaders averaging 17 years of investment experience. Unfortunately, turnover has been high in recent years, partly in conjunction with the firm’s decision the relocate in Tampa, FL based team to NY. Longtime manager Dave Shell left, as did a handful of analysts in late 2011. There was a second wave of turnover in April 2013, when co-manager Scott Kolar departed along with a few more analysts. Analyst Craig Glassner was promoted to co-manager in 2013, and over the next year, the firm hired five new analysts for this team, representing one third of the overall group. Recommendation: Hold and monitor relative performance. Janus Venture: (added to watchlist 3/30/15) HKFS Investment Advisory Committee Summary, March 30th, 2015 4 Internal Use Only, Not to be Distributed to the Public The Janus Venture Fund was added to the watch list due to a management change. JAVTX has gained 16.60% over the past twelve months (peer rank of 1) and has returned 19.75% annualized over the past three years (peer rank of 5) (data through 2/28/15). The fund has outperformed its benchmark- Russell 2000 Growth, during those periods. Maneesh Modi, co-manager with Jonathan Coleman, left Janus at the end of February 2015 to join another firm. He had been an analyst on Janus’ small and mid-cap team for six years. Coleman and Modi took over the fund in May 2013. Coleman has been at Janus since 1994 and has managed various small and mid-cap equity funds since. He is currently Head of Growth Equities at Janus after serving as Equities CIO for 7 years. He is still backed by six small and mid-cap analysts supporting 3 funds, with an average of 9 years’ tenure at Janus. Recommendation: Hold and monitor relative performance. BOND MARKET: At market close on March 27th, the 3-month T-Bill was yielding 0.04%, up 0.03% from last month. The 10-year T-Note was yielding 1.95%, down from 2.02% at this time last month. The spread between the 3-month and 10-year notes tightened from 2.01% to 1.91%. The Barclays U.S. Aggregate Bond Index was down -0.94%. An actual HKFS/Schwab Taxable Income fund portfolio grew 0.53% in February; the SHO model was up 1.16%, both outperforming the Barcap U.S. Aggregate Index loss of -0.94%; the HKFS/SEI Taxable Income fund portfolio was up 0.38%. Four of the seven Schwab model funds outperformed the Barcap Aggregate. The weighted duration of the taxable bond fund portfolio on the HKFS/Schwab platform held at 3.1 in March from February. The weighted duration of the taxable bond fund portfolio on the HKFS/SEI platform was down at 3.9 years in February. An actual HKFS/Schwab Municipal Income fund portfolio had a loss of -0.97% in February, outperforming the Barcap Municipal Index loss of -1.03%. The duration of the municipal bond fund portfolio on the HKFS/Schwab platform fell to 6.0 in March from 6.3 last month. The HKFS/SEI Intermediate-term Municipal Income fund had a loss of 1.11% for the month. The duration of the Intermediate Municipal Fund on the HKFS/SEI platform was reported at 5.5 years as of February. The Investment Advisory Committee reviewed model bond funds currently on ‘watch’ status. The following bond funds are on ‘watch list’ status: Name BlackRock GNMA Reason Std. Deviation, 12-mo Return Current Status Hold BlackRock GNMA: (added to watch list 12/19/13) The BlackRock GNMA Bond Fund is on the watch list due to higher standard deviation vs. its benchmark index and due to 12-mo. underperformance vs. its benchmark. It has a standard deviation of 2.92 vs. 2.58 for the BarCap GNMA index. BGPSX has performed in the top HKFS Investment Advisory Committee Summary, March 30th, 2015 5 Internal Use Only, Not to be Distributed to the Public 50% of its competitors over the past 3 and 5-year periods of time. BGPSX has outperformed over the past 3 years annualized at 2.10% (data through 2/28/15). Recommendation: Hold; the Committee has reviewed other alternatives to lower expense drag, however, found no appropriate substitutes. INVESTMENT OPERATION ISSUES: The Committee reviewed the monthly list of households over $1 million. All non-model account households over $1 million are reviewed annually by the Committee. All households under $1 million are reviewed annually by the HKFS CIO and the HKFS Senior Trader. Accounts are analyzed for non-compliance under the following criteria: actual allocation vs. target allocation with more than a 5% drift from the target, individual stock or bond positions that represent more than 10% of the household assets, and cash positions above 10%. In addition, accounts with individual bond or stock positions that are inconsistent with current policies are noted, with follow-up with advisors mandated. For the month of March, the Committee reviewed 36 client households, representing 150 accounts. There were 31 occurrences outside current HKFS policies that will require followup with the advisor by the HKFS investment team. This month, 127 non-model accounts under $1mm that had no trade triggering activity (such as income or principal deposits, distributions, or maturities) were reviewed by the CIO and Senior Trader. Advisors have been contacted with rebalancing recommendations. The Committee discussed transition of our models from the Schwab rebalancing software to the new Orion/TrX software. There are some additional complexities involved with this software, which will require the creation and continued maintenance of numerous models combining the growth, equity income, income and SHO models at various levels of allocation. The addition of ETF models at numerous allocations would add a significant additional number of models to maintain, which are not being used to any great degree by FAs (currently only 47 accounts are using ETF models). Additionally, using ETFs for some bond sectors is not in the best interest of our clients due to the illiquid nature of bond markets. After discussion, the Committee agreed to limit support of ETF models to accounts using select allocations to growth or equity income. Current modeled accounts using these strategies are encouraged to transition to other models but will not be required to change at this time. All bond ETF models will be permanently discontinued. Assets Under Management ($ thousands): 2/28/15 1/31/15 Schwab (billable) $ 1,758,209 $ 1,705,558 SEI (billable) $ 68,598 $ 66,586 Other (NT, Wells, etc.) $ 33,405 $ 31,717 NextStep $ 28,753 $ 27,665 HKFS RPS $ 337,684 $ 307,215 Total $ 2,226,649 $ 2,138,741 12/31/14 $ 1,685,377 $ 67,037 $ 31,542 $ 27,908 $ 307,249 $ 2,119,113 2/28/14 $ 1,435,507 $ 62,918 $ 29,130 $ 28,365 $ 245,673 $ 1,801,593 The next Investment Advisory Committee meeting is scheduled for Wednesday, April 15th at 10:00am. HKFS Investment Advisory Committee Summary, March 30th, 2015 6
