Visual Analog Scale The visual analog scale
advertisement

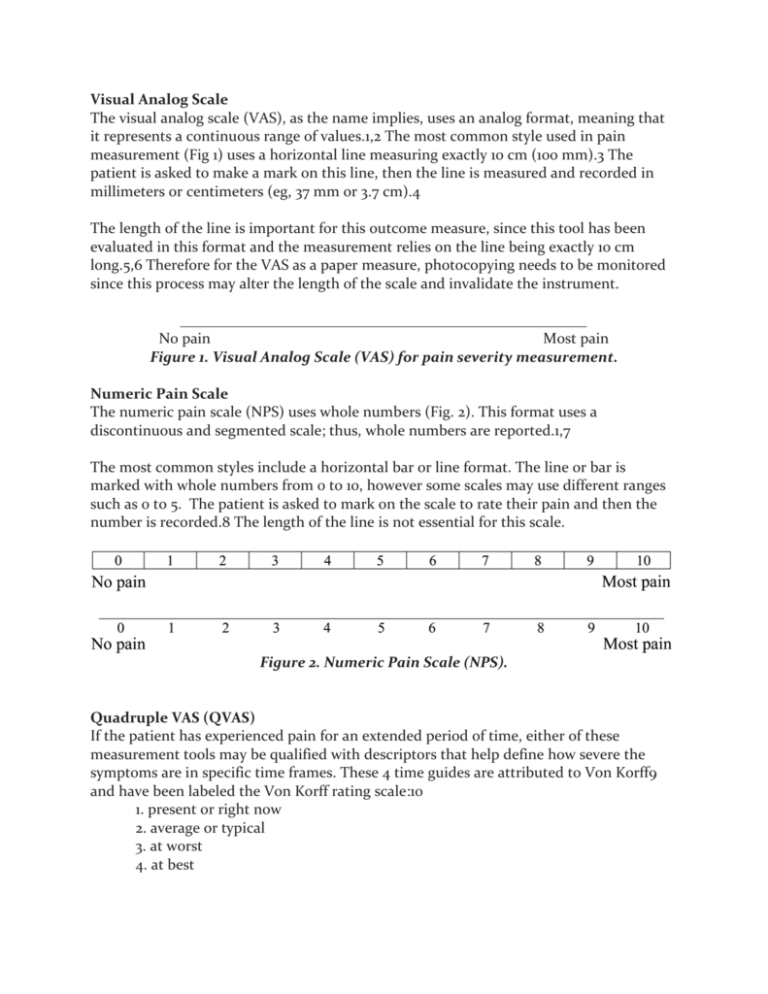
Visual Analog Scale The visual analog scale (VAS), as the name implies, uses an analog format, meaning that it represents a continuous range of values.1,2 The most common style used in pain measurement (Fig 1) uses a horizontal line measuring exactly 10 cm (100 mm).3 The patient is asked to make a mark on this line, then the line is measured and recorded in millimeters or centimeters (eg, 37 mm or 3.7 cm).4 The length of the line is important for this outcome measure, since this tool has been evaluated in this format and the measurement relies on the line being exactly 10 cm long.5,6 Therefore for the VAS as a paper measure, photocopying needs to be monitored since this process may alter the length of the scale and invalidate the instrument. ______________________________________________________ No pain Most pain Figure 1. Visual Analog Scale (VAS) for pain severity measurement. Numeric Pain Scale The numeric pain scale (NPS) uses whole numbers (Fig. 2). This format uses a discontinuous and segmented scale; thus, whole numbers are reported.1,7 The most common styles include a horizontal bar or line format. The line or bar is marked with whole numbers from 0 to 10, however some scales may use different ranges such as 0 to 5. The patient is asked to mark on the scale to rate their pain and then the number is recorded.8 The length of the line is not essential for this scale. Figure 2. Numeric Pain Scale (NPS). Quadruple VAS (QVAS) If the patient has experienced pain for an extended period of time, either of these measurement tools may be qualified with descriptors that help define how severe the symptoms are in specific time frames. These 4 time guides are attributed to Von Korff9 and have been labeled the Von Korff rating scale:10 1. present or right now 2. average or typical 3. at worst 4. at best Other uses of VAS or NPS VAS or numeric scales may also be used for other symptoms not just pain.11–13 For example, discomfort, stiffness, dyspnea, or itchiness may be measured using either of these scales. Therefore if a patient with asthma presents with dyspnea, the difficulty in patient’s perception of breathing may be measured using these scales. Regardless of which scale is used in practice, and whether or not the scale measures for pain or other symptoms, the type should be reported clearly so that the reader knows which type of scale is being used. Using the VAS in Clinical Decision Making The VAS is useful in assisting both patients and their clinicians to make decisions about treatment. Patient-centered. Engaging each patient in their recovery can be facilitated by the VAS. Helping patients understand how to use the VAS and what it means to you as their clinician assists in enhancing the therapeutic relationship and shared decision making. Timing. The VAS should be used at an initial evaluation of a new patient or an established patient with a new problem and then at appropriate intervals thereafter. It is important to use the same VAS (VAS, NPS, QVAS, etc) each time for comparison. The interval between evaluations depends on the nature of the presenting problem and the expected clinical course. Acute problems usually see improvement over a course of days or weeks and repeat VAS in this time-frame is appropriate. Chronic problems might warrant repeat VAS measurement at intervals of from 2 weeks to 2 months. Goals of treatment. VAS scores can be used as explicit treatment goals. For example, a treatment plan could include: “Goals of treatment include reduction of the current VAS score of 7 to 3 over the initial 2 week period of treatment. Expect VAS of 0-1 within 6 weeks.” References 1. Breivik EK, Bjornsson GA, Skovlund E. A comparison of pain rating scales by sampling from clinical trial data. Clin J Pain 2000;16:22–8. 2. Miller MD, Ferris DG. Measurement of subjective phenomena in primary care research: the Visual Analogue Scale. Fam Pract Res J 1993;13:15–24. 3. Ogon M, Krismer M, Sollner W, Kantner-Rumplmair W, Lampe A. Chronic low back pain measurement with visual analogue scales in different settings. Pain 1996;64:425–28. 4. Scrimshaw SV, Maher C. Responsiveness of visual analogue and McGill pain scale measures. J Manipulative Physiol Ther 2001;24:501–4. 5. Sriwatanakul K, Kelvie W, Lasagna L, Calimlim JF, Weis OF, Mehta G. Studies with different types of visual analog scales for measurement of pain. Clin Pharmacol Ther 1983;34:234–9. 6. Joyce CR, Zutshi DW, Hrubes V, Mason RM. Comparison of fixed interval and visual analogue scales for rating chronic pain. Eur J Clin Pharmacol 1975;8:415–20. 7. Lundeberg T, Lund I, Dahlin L, Borg E, Gustafsson C, Sandin L, et al. Reliability and responsiveness of three different pain assessments. J Rehabil Med 2001;33:279–83. 8. Mader TJ, Blank FS, Smithline HA, Wolfe JM. How reliable are pain scores? A pilot study of 20 healthy volunteers. J Emerg Nurs 2003; 29:322–5. 9. Von Korff M, Deyo RA, Cherkin D, Barlow W. Back pain in primary care. Outcomes at 1 year. Spine 1993;18:855–62. 10. Underwood MR, Barnett AG, Vickers MR. Evaluation of two timespecific back pain outcome measures. Spine 1999;24:1104–12. 11. Shikiar R, Bresnahan BW, Stone SP, Thompson C, Koo J, Revicki DA. Validity and reliability of patient reported outcomes used in psoriasis: results from two randomized clinical trials. Health Qual Life Outcomes 2003;1:53. 12. Rosi E, Lanini B, Ronchi MC, Romagnoli I, Stendardi L, Bianchi R, Zonefrati R, Duranti R, Scano G. Dyspnea, respiratory function and sputum profile in asthmatic patients during exacerbations. Respir Med 2002;96:745–50. 13. Woolf GM, Reynolds TB. Failure of rifampin to relieve pruritus in chronic liver disease. J Clin Gastroenterol 1990;12:174–7. Resources http://www.mindbodymedicine.com/images/qvas_form.pdf QUADRUPLE VISUAL ANALOGUE SCALE Patient Name ________________________________________________ Date ___________________________ Please read carefully: Instructions: Please circle the number that best describes the question being asked. Note: If you have more than one complaint, please answer each question for each individual complaint and indicate the score for each complaint. Please indicate your pain level right now, average pain, and pain at its best and worst. Example: Headache Neck Low Back No pain ________________________________________________________________________________ worst possible pain 0 1 2 3 4 5 6 7 8 9 10 1 – What is your pain RIGHT NOW? No pain ________________________________________________________________________________ worst possible pain 0 1 2 3 4 5 6 7 8 9 10 2 – What is your TYPICAL or AVERAGE pain? No pain ________________________________________________________________________________ worst possible pain 0 1 2 3 4 5 6 7 8 9 10 3 – What is your pain level AT ITS BEST (How close to “0” does your pain get at its best)? No pain ________________________________________________________________________________ worst possible pain 0 1 2 3 4 5 6 7 8 9 10 4 – What is your pain level AT ITS WORST (How close to “10” does your pain get at its worst)? No pain ________________________________________________________________________________ worst possible pain 0 1 2 3 4 5 6 7 8 9 10 OTHER COMMENTS: ______________________________________________________________________________________________________ ______________________________________________________________________________________________________ ______________________________________________ Examiner Reprinted from Spine, 18, Von Korff M, Deyo RA, Cherkin D, Barlow SF, Back pain in primary care: Outcomes at 1 year, 855-862, 1993, with permission from Elsevier Science.


