Graph comparing Page Views in March and April
advertisement
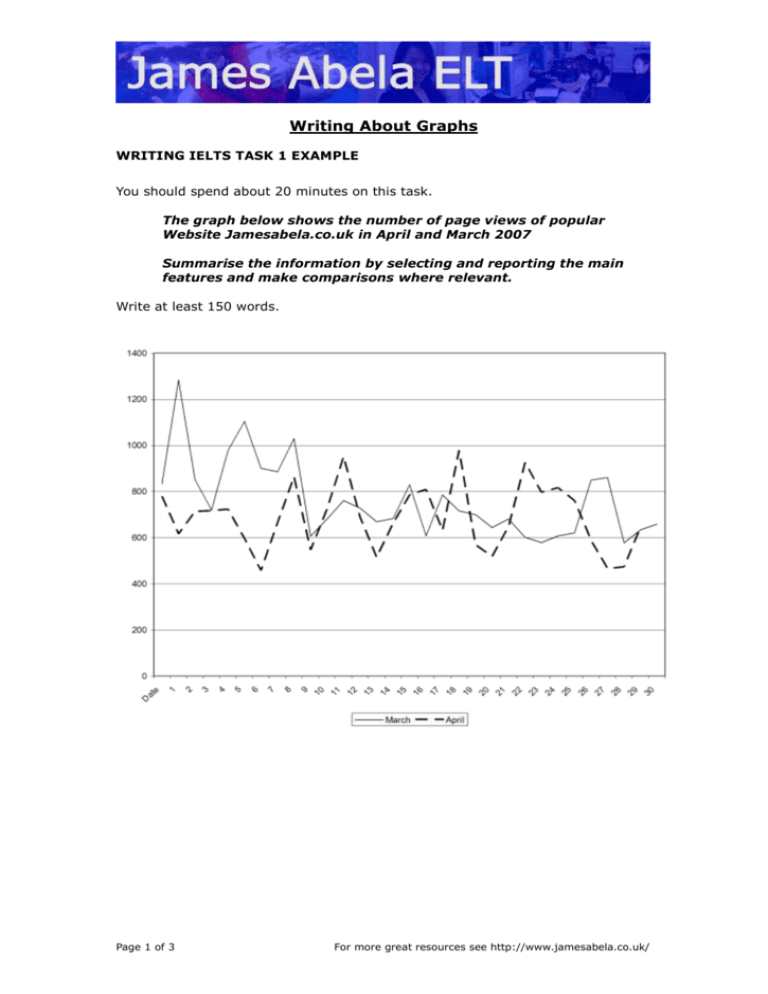
Writing About Graphs WRITING IELTS TASK 1 EXAMPLE You should spend about 20 minutes on this task. The graph below shows the number of page views of popular Website Jamesabela.co.uk in April and March 2007 Summarise the information by selecting and reporting the main features and make comparisons where relevant. Write at least 150 words. Page 1 of 3 For more great resources see http://www.jamesabela.co.uk/ Useful Vocabulary Verb to to to to to to Past Simple rose (irr) increased improved fell (irr) decreased recovered rise increase improve fall decrease recover ADJECTIVE slight sharp dramatic steady ADVERB slightly sharply dramatically steadily Past Participle risen (irr) increased improved fallen (irr) decreased recovered HOW MUCH CHANGE? very small sudden, large sudden, very large regular Form April's page decreased views Page views increased Subject verb (Past Simple) (…) – Spoken only slightly on (the) 21st dramatically adverb March object Guided Writing The following guide gives you an idea of the amount you are expected to write and an idea of suggested timings for writing this kind of task. Task Approach Time Time Task Used left Start exam 0 20 0 Read Question Read question carefully 5 15 5 Introduction Rewrite the question in your own formal words 7 13 2 Highest overall page views Compare the first third of the month The three April peaks 22nd - 26th April page views are higher than March Late plateau in March 16 4 9 A lot of fluctuation, but generally between 600 to 800 page views per day. Why do you think this might be? 18 2 2 20 0 2 Write Body ● ● ● ● ● Conclusion ● ● Grammar Check Page 2 of 3 For more great resources see http://www.jamesabela.co.uk/ Sample Answer The graph shows the page views for jamesabela.co.uk in 2007 for the months of March and April. The highest peak is on 2nd March when page views reach nearly 1300 and the lowest number of page views is on 6th April when there are just over 400 views. In the first third of the month March's figures are considerably higher than April's, but the two figures become much closer for two days on the 8th and then April figures reach their first peak. Both sets of figures continue to fluctuate until the 18th when March's figures begin a steady decline, while April's figures sky-rocket, crash and climb steeply again. On the 23rd April's figures reach their final peak, which March's figures reach a plateau on the 28th. Interestingly on the 30th they meet again. Overall this graph shows wild fluctuations, but generally within the 800 to 600 views range. (149 words) Teaching Ideas 1. One useful technique to introduce some fun to the class, is to split students into pairs and get them to sit back-to-back. Then give one student the graph and get the other student to draw the graph based on what they hear. 2. The Useful vocabulary is just a start to ensure that they have some words to use, but try to elicit more to make their text look more interesting and gain more points for use of vocabulary. 3. After students have written their answers get them to compare the vocabulary used so that students can extract any fresh vocabulary and ideas from each other. 4. Depending on ability give the guided answer and/or vocabulary. IELTS The Ultimate Unofficial Guide It gives us great pleasure to offer the very first IELTS Guide for the Kindle. It is for the ACADEMIC exam and NOT the general test. I have trained more than 1000 students and another 30,000 have downloaded materials from my Website to pass the IELTs exam and what started as a few notes for my students has ended up as a complete guide. I maybe the author, but my students have spent years telling me, what they need to know and what I need to do to make sure that they get past the test! Get It Here>> Page 3 of 3 For more great resources see http://www.jamesabela.co.uk/
