1 Chapter 9 The Analysis of Competitive Markets Minimum prices
advertisement
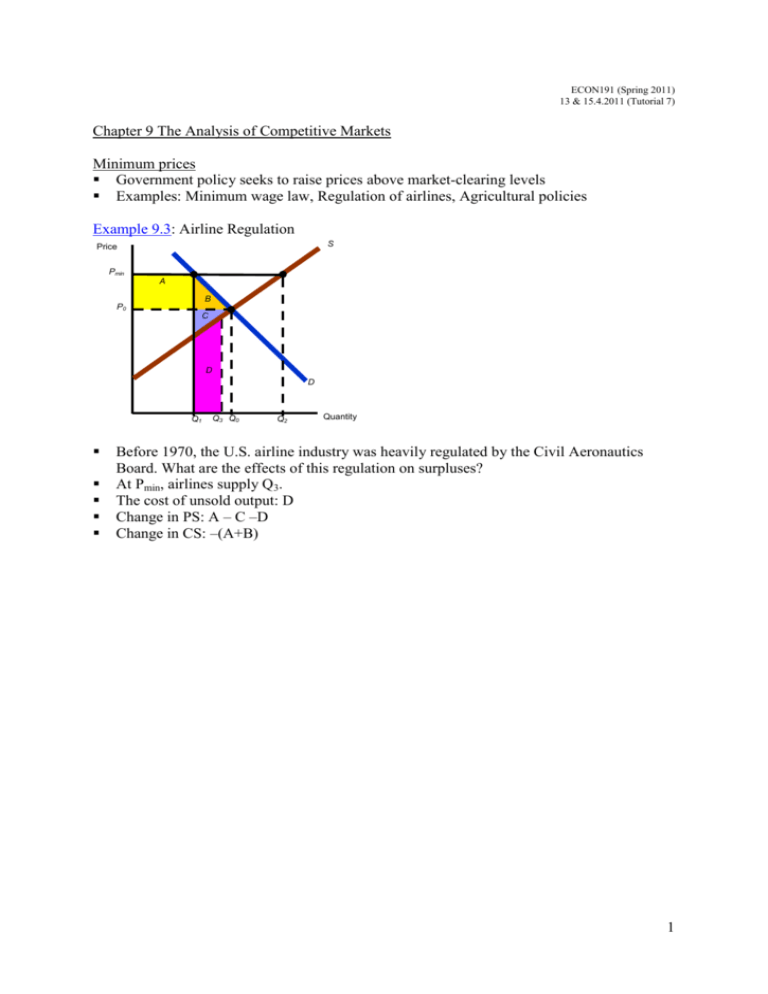
ECON191 (Spring 2011) 13 & 15.4.2011 (Tutorial 7) Chapter 9 The Analysis of Competitive Markets Minimum prices Government policy seeks to raise prices above market-clearing levels Examples: Minimum wage law, Regulation of airlines, Agricultural policies Example 9.3: Airline Regulation S Price Pmin A B P0 C D D Q1 Q3 Q0 Q2 Quantity Before 1970, the U.S. airline industry was heavily regulated by the Civil Aeronautics Board. What are the effects of this regulation on surpluses? At Pmin, airlines supply Q3. The cost of unsold output: D Change in PS: A – C –D Change in CS: –(A+B) 1 Price supports and production quota Price set by government above free-market level and maintained by government purchases of excess supply Example 9.4: Supporting the price of wheat Price S In 1981, Supply: Qs = 1,800 + 240P Demand: QD = 3,550 – 266P Price = $3.46 and Quantity = 2,630 Qg P0 = $3.70 A B P0 = $3.46 C D + Qg D 1,800 2,566 2,630 2,688 Quantity Government raised the price to $3.70 through government purchases of 122 million bushels (At P = 3.70, QS = 2688, QD = 2566) Loss in CS: – (A + B) = –$624 Gain in PS: (A + B + C) = $638 Cost to the government: $3.7 × 122 = 451.4 Price S’ S In 1985, export demand fell. Supply: Qs = 1,800 + 240P Demand: QD = 2,580 – 194P Price = $1.8 and Quantity = 2,231 QS P0 = $3.20 P0 = $1.80 D + QS D 1,800 1,959 2,232 2,425 Quantity The government wanted to keep the price at $3.20 and at the same time, it imposed a production quota of 2425 million bushels 2,425 = 2,580 – 194P + QG QG = -155 + 194P QG = -155 + 194($3.20) = 466 million bushels Cost to the government: $3.2 × 466 = 1491 2 Import quotas and tariffs Import quota: Limit on the quantity of a good that can be imported Tariff: Tax on an imported good Example 9.5: The sugar quota Price (cents/lb.) DUS SUS PUS = 21.5 after quota D 20 A 16 C B 11 PW = 8.3 before quota 8 4 1.4 17.4 20.4 Quantity 24.2 (billions of pounds) The world price of sugar is lower then the price in U.S. Sugar quotas have protected the sugar industry but driven up prices Domestic producers and foreign producers have quota rights are better off while consumers are worse off Supply in U.S.: QS = – 8.70 + 1.21P Demand in U.S.: QD = 26.53 – 0.29P At PW = 8.3, import = 22.8 billion With a quota of 3 billion, PUS = 21.5 Costs to consumers: A + B + C + D Gain to producers: A Gain to foreign producers: D DWL: B + C 3 The impact of a tax or subsidy Specific tax: tax of a certain amount of money per unit sold Subsidy: payment reducing the buyer’s price below the seller’s price (a negative tax) Example 9.7: Tax on gasoline The goal of a large gasoline tax is to raise government revenue, reduce oil consumption and reduce US dependence on oil imports D Price ($ per gallon ) Pb = 1.22 $0.50 Tax P0 = 1.00 S B A D C PS = .72 11 50 60 89 100 150 Quantity (billion gallons per year) Demand: QD = 150 – 50P Supply: QS = 60 + 40P Price = $1 and Quantity = 100billion With a 50 cent tax, 150 – 50Pb = 60 + 40PS 150 – 50(PS+ 0.50) = 60 + 40PS PS = 0.72 Pb = PS + 0.50 = $1.22 QD = QS = 89 bg/yr Loss to consumers: A + B (Tax burden: 22cents) Loss to producers: C + D (Tax burden: 28 cents) Government revenue: A + D DWL: B + C 4
