Computational Molecular Biology
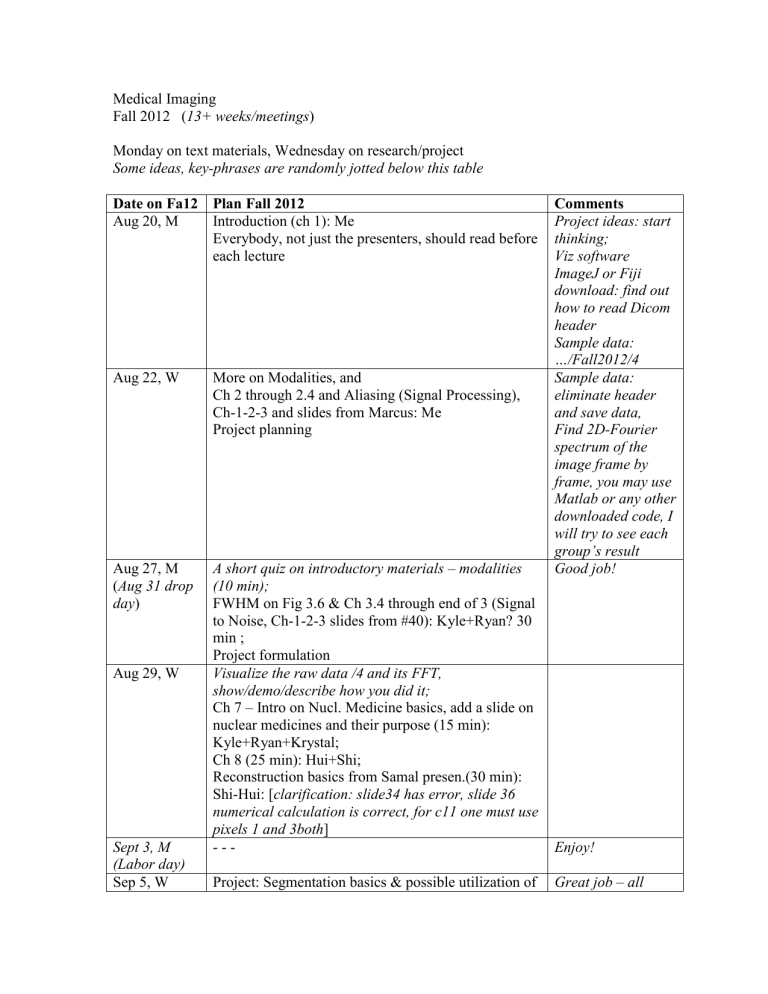
Medical Imaging
Fall 2012 ( 13+ weeks/meetings )
Monday on text materials, Wednesday on research/project
Some ideas, key-phrases are randomly jotted below this table
Date on Fa12 Plan Fall 2012
Aug 20, M
Aug 22, W
Introduction (ch 1): Me
Everybody, not just the presenters, should read before each lecture
More on Modalities, and
Ch 2 through 2.4 and Aliasing (Signal Processing),
Ch-1-2-3 and slides from Marcus: Me
Project planning
(
Aug 27, M
Aug 31 drop day )
A short quiz on introductory materials – modalities
(10 min);
FWHM on Fig 3.6 & Ch 3.4 through end of 3 (Signal to Noise, Ch-1-2-3 slides from #40): Kyle+Ryan? 30 min ;
Project formulation
Aug 29, W Visualize the raw data /4 and its FFT, show/demo/describe how you did it;
Ch 7 – Intro on Nucl. Medicine basics, add a slide on nuclear medicines and their purpose (15 min):
Kyle+Ryan+Krystal;
Ch 8 (25 min): Hui+Shi;
Reconstruction basics from Samal presen.(30 min):
Shi-Hui: [ clarification: slide34 has error, slide 36 numerical calculation is correct, for c11 one must use pixels 1 and 3both ]
- - - Sept 3, M
(Labor day)
Sep 5, W Project: Segmentation basics & possible utilization of
Enjoy!
Great job – all
Comments
Project ideas: start thinking;
Viz software
ImageJ or Fiji download: find out how to read Dicom header
Sample data:
…/Fall2012/4
Sample data: eliminate header and save data,
Find 2D-Fourier spectrum of the image frame by frame, you may use
Matlab or any other downloaded code, I will try to see each group’s result
Good job!
Sep 10, M
Sep 12, W
Sep 17, M
Sep 19, W
Sep 24, M
Sep 26, W
ITK-SNAP (15 min): Danielle+Daphne;
Ch 8 and 9, SPECT, PET (10+30 min): Shi-Hui;
Project: Wavelet basics (15 min): Ehsan+Hemin
Quiz on Emission Tomography (10 min);
Ch 4 & 5-briefly, Radio-physics, X-ray basics (15 min – looks like Ch5 itself has 15+min talk, take your time): Danielle+Daphne;
Image filtering with FFT - demo
Shi+Hui: Bryuant paper, including all Appendices up to 5, and Static MLEM recon (35 min): Shi+Hui;
Project of M-R: human gated data (10 min) by Hui,
Gated human data project discussion,
Daniel on SinoCor (20 min);
Ch 4 & 5, Radio-physics, X-ray basics, Radiography including some problems (40 min): Danielle+Daphne;
[Look below];
Quantum Efficiency: http://en.wikipedia.org/wiki/Quantum_efficiency;
Wavelet-filtering demo on sinogram (E-G): great!
More: 1) show also the wavelet co-efficients of frames, 2) send me the code to run on /4 myself, 3) understand what type of wavelets you are using, ,,,
I introduce dynamic imaging (15 min), Mahmoud on
dynamic imaging, & code-exposure for
Simulation project (20 min): K-R-K, and rat dynamic reconstruction discussion: H-S;
Ch 6 CT, with a few exercises, exclude Fan Beam reconstruction, touch Con-beam ( 60 min ):
Guy+Ehsan
Rest of Bruyant paper (15 min): Hui+Shi, good job
Segmentation demo (15 min): Daphne+Danielle , great progress - try to segment our data, find other presentations!
Looks like we will see successful
SNAP demo soon;
Ehsan+Guy: Add noise to /4 and FFT
– compare with and without noise
Filter FFT sequences and then inverse-FFT back to image;
All: Your text presentation should be sent to me, after updating as per suggestions
in the class
FBP Recon assignment: /4, due:Oct-1
Quiz on Bryuant paper will include
Appendices up to 3
Much better than before! – every group: read chapter at least twice before your presentation, others read before+after presentation
Thanks to Daniel and Mahmoud!
Great job!
Add projection slice theorem to slides.
Each of the other groups: report progress (5-10 min
Oct 1, M
Oct 3, W
Oct 8-9,
(Fall Break)
Oct 10, W
Oct 15, M
Oct 17, W segmentation techniques available
Short quiz on Ch 4-5-6 (15 min);
Start of MRI physics from Text, Ch 12 basics: Mohit-
Rajan, or I
Ch 12 continued: M-R;
Project: M-R (show the gated sinogram and CG motion-plot), D-D segmented /4 sinogram
- - - -
3D FBP demo, all groups;
Project: H-S (explain briefly what is CG, regularization on CG, and show your L-curve, Ucurve, recon images), K-R-K, E-H,, D-D … each)
READ FROM
BOOK, NOT
FROM SLIDES!!!
Hui -> D-D new 3d data for segmentation;
PROPER sinogram
1D slices (over patient-axis) to be recon to a volume
2D slice, loop over slices for 3D recon;
First show this backprojection, then do filtering on sinogram before backprojecting for
FBP
10/29-31 classes MRI Ch 12 finish: M-R
Ch-13 start (up to: any point): H-S
Project + FBP Suggestion: take a
4x4 2D matrix – all
1’s, radón to 1D
4bin detector – 5deg steps, then iradon back to 4x4 volume
Oct 22, M
Oct 24, W
( Oct 26 Drop with ‘W’
)
Oct 29, M
MR Ch 13 finish / as much as possible: H-S
Ch 12 Quiz
K-R-K, E-G, M-R,
D-D, H-S
- you present to the class, not just to me, describe some background each time
- each group gets 10/15min class-time, not more, so prepare, think ahead what are relevant things that you may be needed to show if asked for
- start drafting a report in powerpoint putting your results there and keep updating it
- draft is due every subsequent weekend (10 pts each wk)
Conf:
Great job everybody!!;
My comments are below: Send me updated presentation by the weekend;
Project
Oct 31, W
Nov 5, M
Nov 7, W
Nov 14, W
(Nov 12
Veterans
Day) http://www.nss-mic.org/2012/NSSMain.asp
Project: H-S, D-D, M-R, K-R-K, G-E
to IEEE MIC conf . -
Ch 13 continue: H-S
Project: some closure (only 2 more W left for my feedback & your finalizing)
Project first draft report submit by weekend
11/11/2012;
PACS Picture-Archiving-system (25 min): Hui-
Krystal
Filtered back projection assignment;
Nov 19, M
Nov 21-23
Thanksgiving
Nov 26, M
Ultra Sound (Ch 10 & 11, in 2 days ): K-R-K [45 min];
Forward-backward projection quiz discussion [10 min]
- -
MRI review (10 min);
Ultra Sound (continued, 45 min): K-R-K;
MRI Quiz [15 min];
Review
Nov 28, W
Dec 3, M
Repeat your updated presentation and results:
K-R-K; S-H; M-R ;
Other modalities
Ultrasound Ch10-11 quiz (30 min, Open Book);
Summary of the course;
MR-quiz discussion presentations: send me slides
Bruyant-paper
Quiz;
Back-projection
project
Congratulations, each group!
- what was given to
D-D from PET data?
- quick view of edge CoG offsets:
M-R
- Have you all updated-sent your project?
All presentations are posted – any missing one should be sent to me asap!
I WILL ADD SOME
NOTES BELOW
ON PROJECT;
EACH GROUP
MUST DRAW
SOME
CONCLUSIONS
FROM, OR MAKE
SOME
OBSERVATIONS
ON YOUR
RESULTS
Add in your final slides: Specific things that you have learned in doing the project
Expect some general questions that should not need any preparation
Dec 5, W
(Last day of class)
US Quiz discussion;
Repeat your updated presentation and results:
Segmentation (D-D, 20 min);
Wavelet analysis (E-G, 20 min);
Time permitting:
K-R-K update; M-R update; S-H update
Any text presentation or project material must be submitted by Dec 12 W
Dec 12, W
8:30-10:30
Exam time
- - -
EXTRA:
Zeng Recon book, Visualization: Fiji, Amede; PMOD
I am missing Ch13 on MRI
PROJECT/ STUDY-TOPICS IDEAS:
Guy+Ehsan: Wavelet analyses on sinograms:
Data: Static rat SPECT sinogram from summed multiple rotations of Dynamic imaging,
(1) /4 file; (2) Motion-induced sinograms from NCAT SPECT human: GET FROM K-
R-K ;
Tasks: analyze with 2D wavelets – frame by frame – producing co-efficient images, filter and reproduce sinograms; if possible recon with FBP.
Report: (1) Wavelet co-eff of /4 sinogram, filtered /4 by wavelet, if possible – its iradon after filtering; (2) same steps for K-R-K’s simulated sinogram; (3) You matlab code with
Readme comments on how to use it.
Hui+Shi: Reconstruct ECT with Maximum Likelihood Expectation Maximization.
Reconstruct with Conjugate Gradient (basics in numerical recipe book),
Data source: simulation dynamic SPECT data
Code source from Mahmoud,
Expt.: systematically vary different lambda for constraints.
Update code from Mahmoud, verify Mahmoud’s results with same iteration as his, Draw
L/U plots with two independent axes - lambda1 and lambda2 (3D plot) – to find where the corner of L and the bottom of U appears.
Mohit+Rajan: [ Human Gated SPECT data 2006 @lbl on Cardiac motion, find out what type of motion exists, if any.
(Part 1) Plot locus of CoG x-y co-ordinate;
Analyze (Fourier) spectrum, of CoG motion (1D time-series, x and y-axis);
-- More: if you can finish this in time: sliding window FFT -----
Do the same for data from each of the 8 gates;
(Part 2) Create gradient image by doing as follows:
Smooth each frame first using ImageJ, then edge-detect on each frame and save;
Repeat all of the above for this gradient image;
Keep all resulting data files, and submit them with proper naming of files, and a readme file.
I gave some feedback on your slides already, will provide more suggestions after you fix them; Most important is the power spectrum of y-CoG (not offset, not gradient) – draw your observations on that.
Danielle+Daphne : [Segmentation http://en.wikipedia.org/wiki/Segmentation_(image_processing) ]
ITK-SNAP from UPenn, semi-automated intelligent scissor: http://www.itksnap.org/pmwiki/pmwiki.php
1) Download and install ITK-SNAP from above site.
2) Segment the sinogram on /4 using SNAP;
3) Read selected paper(s) on SNAP, understand and present on SNAP mechanism;
4) Demo SNAP, and create a short manual for others – for using SNAP;
5) Describe briefly each algorithmic tool available; Does level-set method exists there?
6) What are the output(s) forms available? Can you use it to mask out non-ROI regions?
7) Is source code available? Do they have APIs to use their code? IP issues in using it?
8) PET image of heart 3D segmentation (sit with Hui on this project, if necessary)
3D PET data segmentation; how to save mask(s)?
Kyle+Ryan+Krystal : [Simulation of 3D geometry emission data for dynamic imaging, with not-known time-activity-curves, with and without Poisson noise, run Mahmoud’s code for reconstructing co-efficients+TACs with basis-functions]
With NCAT simulated human dynamic sinogram, generated with two/three factors, use
B-splines to re-produce the 3 time-activity curves. Input : Data: dynamic sinogram, static volume. Matlab codes: 1.B-spline generator, 2. Time-activity-curves clustering, C codes: for co-efficient reconstruction. Output : 1. Reconstructed co-efficient volumes, (dynamic recon volumes are too space expensive to store), time-activity curves’ clusters over all voxels.
Possibly add Poisson noise to the dynamic sinogram – if time permits.
[Send input image to E-G.]
Objective of experiment: come up with the best B-splines for the analysis.
Further 2: Run more with the cluster representative curves, in order to improve the latters.
Further 1 (Krystal): From literature find out if there is any SPECT/PET tracer timeactivity information of any type of tumor or cardiac disease. Can you find genetic expressions in heart diseases, so that they may be targeted for imaging:
Make it clear: initialization splines, intermediate resulting-TACs, final TACs after those intermediate TACs and corresponding co-efficients are used as initials – in case you have dome this later step.
=================== COMMENTS FROM 10-24-12 W CLASS ==========
K-R-K: Dynamic imaging
- Show the formulas on your slides;
- Sample input and output to each code module gives better impression on what this part is supposed to do;
- add cluster quality number for each curve on each output;
- Krystal will send the article to me;
E-G: Wavelet analysis of sinogram
- We should provide you with more sinogram, including that from simulation(s), and from motion;
- Show mother-wavelet’s time and frequency curves;
- add relevant references that you used, on the slides;
- on the slide with Matlab code: show a 2x2 table depicting where (a, h, v, d) are to be located;
- which frame did you process?: put the frame no. on the slide;
- Check mother-wavelet-processed image: looks like it is 16x16, should be 33x33;
- Write your conclusion/observation on or after each result slide;
- Try FBP with wavelet filtering, instead of FFT filtering;
M-R: Ctr of Image motion analysis
- Do Fourier analysis for 1 st
head only (first half of the sinogram);
- label each plot (understand what is your “frequency”);
- include your Matlab code on a slide;
- Use the 2D image provided in Bruyant paper-Quiz, plot the 1D X-CoG for 8 frames
MANUALLY (as an exercise to understand what CoG is);
D-D: ITK-SNAP segmentation
- list all the algorithms (called “tools”) available, e.g., manual, snake, anything else?;
- in what format the output may be saved, i.e., how are the segmentations saved, how can we use it, can we save a mask?;
- try this: segment any one organ (heart or liver) on sinogram /4, and try to reconstruct the
3D image using iradon or the FBP recon that you are working on;
On tutorial slides, use arrows to link your text to the figures;
=============== END NOTE 10-24-2012 W =========================
=============== NOTES ON 11-07-2012 W ==========================
THE FOLLOWING COMMENTS ARE MOSTLY REGARDING YOUR
PRESENTATIONS/REPORTS. TODO LIST FOR FURTHER WORK IS IN THE
PROJECT DESCRIPTIONS ABOVE…
KRK:
- Understand the formulas you are using, this is what the C code implements, I expect little bit more discussion on each formula on your slides that shows your understanding,
Krystal: you too must understand the formulas and the process used here;
- Put X and Y axes labels on plots;
- Write a summary and your conclusion from experimentation;
- A definition of “innervation” (and any other disease you address in future) and its clinical implication(s);
DD:
Good job, so far!
MR:
- For comparing the plots try to put them on the same page, always include input timeseries that is being analyzed;
- You will draw some conclusion: what types of periodicities are being observed from analysis, etc., do not depend on me to make the observations – it is your project!;
HS:
- Include dynamic-image works too;
- Can you think of any better and objective way to find which lambda values are to choose?
EG:
- How to visualize in your slides the wavelet co-efficients along with the corresponding input frames, and the resulting filtered frames? Possibly, showing about a few sample frames? On the ImageJ “slash-views”?
- However, in your submission do submit full data, input + your results, in a zip archive, write a “readme” file on how to modify your code to “play” as you were doing in class;
- Compare FFT-FBP recon against Wavelet-FBP recon;
============== END NOTE 11-7-12 W ==================
3D image comparison metrics
IR Laser diffusion optical tomography with Kunal data, - Harvard group?
Manifold learning
Set up XCAT on our lab machine
Time of flight PET: ask from Ron Huessman
KEY TERMS IN INTRO:
In-vivo imaging (as opposed to in-vitro)
Multiple modalities (OB: p6-8)
Radiography vs. Tomography
Tomography and Image-processing Algorithms
Physics and Engineering: for scanners
Mathematics, Algorithms: for processing
Image understanding (mostly manual): Anatomy, Physiology, Functional, Molecular
Clinical Applications: Prognosis, Diagnosis, Therapy, Surgery
System Flow chart: Fessler p3-4
EM Wave range: Fessler p5
Mechanical Wave: Ultrasound
KEY TERMS ON MODALITIES:
Objective of medical imaging modalities:
Obtain in-vivo information on (image) anatomy, physiology, functioning, or molecular kinetics, etc.
CT: X-ray absorption in tissues
Nuclear: Gamma radiation source concentration
MRI: hydrogen atom distribution
Ultrasound: wave impedance by echo at boundaries
Other modalities…
Almost each modality generated a Nobel Prize!
Expect a short quiz next class, on intro.
KEY TERMS IN NUCLEAR MEDICINE:
Radioactivity, Half-life, Radiation type, dose, Tracers,
KEY TERMS IN NUCLEAR MEDICINE MODALITIES
Emission types, Detector, Collimator, Detection logic, detection type and statistics,
Detection geometry,
KEY ON CH4 X-RAY BASICS
[I will join you on presenting]
Ch 4.2 atomic structure, shells, ionization
4.3 photon and em wave
4.4 electron hitting atom, fig 4.4, 4.5
4.4 photon hitting atom, fig 4.6
4.5 beam strength, 4.5.2 attenuation eq4.23 4.30, poly-energy eq4.34
KEY ON CH5 X-RAY RADIOGRAPHY
[slides are pretty good, make sure you have understood or bring it up for discussion]
Fig 5.2 schematics,
Ch 5.1 x-ray generation , pg140 beam hardening, source-side collimator Fig5.6,
Compensation filter fig 5.7, pg 143 contrast agent,
Ch 5.2.4 detector-side collimators – pros and cons
Ch 5.3 image eq5.3, spherical wave eq5.5, blurring for collimator Fig 5.18
Ch5.4 eq5.33 fig5.23 contrast, eq5.34 snr,
Eq5.41 Compton scattering contrast
KEY ON CH6 CT
Generations table6.1,
6.2.3 detectors, 6.2.4 mechanical parts,
6.3.1 attenuation, 6.3.2 ct numbers,
6.3.3 parallel ray projections, pg 197 backprojection,
Pg 198 projection-slice thm, ,,,
Summary of text
Ch5 X-ray Physics: Shadowgraphy, absorption/attenuation imaging, electron beam to Xray, Bremstahlung & K-line radiation, Source collimation, intensity vs frequency from mA vs Voltage, basic absorption eq 5.3, SNR or signal over background as eq 5.34
Ch6 CT: Generations, 1D-2D-3D, Photo-diode Detectors, FWHM =full width half max,
Image eq 6.1, CT numbers for measurement, Parallel ray projection as Radon transform and reconstruction as Iradon, Sinogram as projection/radon, Filtered back-projection,
FFT by shifting FT in polar co-ordinate
Ch7 Nuclear medicine physics: Radioactivity, Tracers as clean radiation versus functional aspect
Ch8 Scintigraphy: Collimators, Detection with crystal->PMT, Anger camera image eq
8.9, Gated acquisition for cardiac imaging
Ch9 ECT: SPECT with gamma radiation, PET with positron->gamma, Image eq 9.5 over view angles and eq 9.7, PET coincidence count eq 9.17 (attenuation is constant added from two sides), Reconstruction same as CT
C10 US Physics: Acoustic wave eq 10.1, and 10.4, frequency-wavelength-wavenumber, energy-intensity, reflection-refraction-scattering-attenuation, Doppler change of frequency measures object velocity, planar source->beam patterns, reflected wave equation from different depth
Ch11 US imaging: piezoelectric generator/receiver, scanning, pulse, A-M-B-modes of scan, dB measurement unit eq 11.21, electronic-phase change over transducer array to steer/focus US
Ch12 MRI Physics: nuclear spin-proton only, precession at Larmor frequency under magnetic field, larger precession angle with resonant radio wave, spatial variation of magnetization varies Larmor freq over body, relaxation generates back radio wave for detection, FID decay vs. recovery – 2 modes, Bloch eq 12.36, Pi RF “pull” causes extra signal – spin echo, three modes of contrasts dependent on material
Ch13 MRI imaging: B-G-RF 3 components, G encodes spatial position over uniform B, range of Larmor freq encoded with superimposed RF pulse with a sinc waveform fig 13.9,
Pulse seq with negative G for refocusing fig 13.10, variation over slice with Gx and Gy
=> FT of space, Fourier space is covered with gradient echo or –ve G, spin-echo with Pi
RF pulse, Reconstruction from FT space eq 13.47
Learning from Project [what more should have been learned]:
Spline analysis: dynamic data with tissue-time activity, what is B-spline, spectral analysis
– how multiple basis functions can tell you what is in the data, [more different types of input could have been generated, how the co-efficients look like, more on spectral analysis with different types of bases]
Molecular Imaging: how to dig into MICAD database, MIBG and its use [more on molecular imaging agents and how do they interact with physiology]
Wavelet analysis: how to use matlab for wavelet spectral analysis, 2d+theta dimensional sinogram handling [how to extract information from images by wavelet analysis]
Fourier analysis: what does 1D fourier analysis do, how to do it, gated sinogram handling,
[any periodic change in gated vs ungated frames]
Segmentation: what is segmentation, how to use itk-snap software, [3d segmentation, use of segmentation]
Regularization: importance of regularization in optimization, how to analyze dynamic data
