Econ 1: Principles of Microeconomics
advertisement
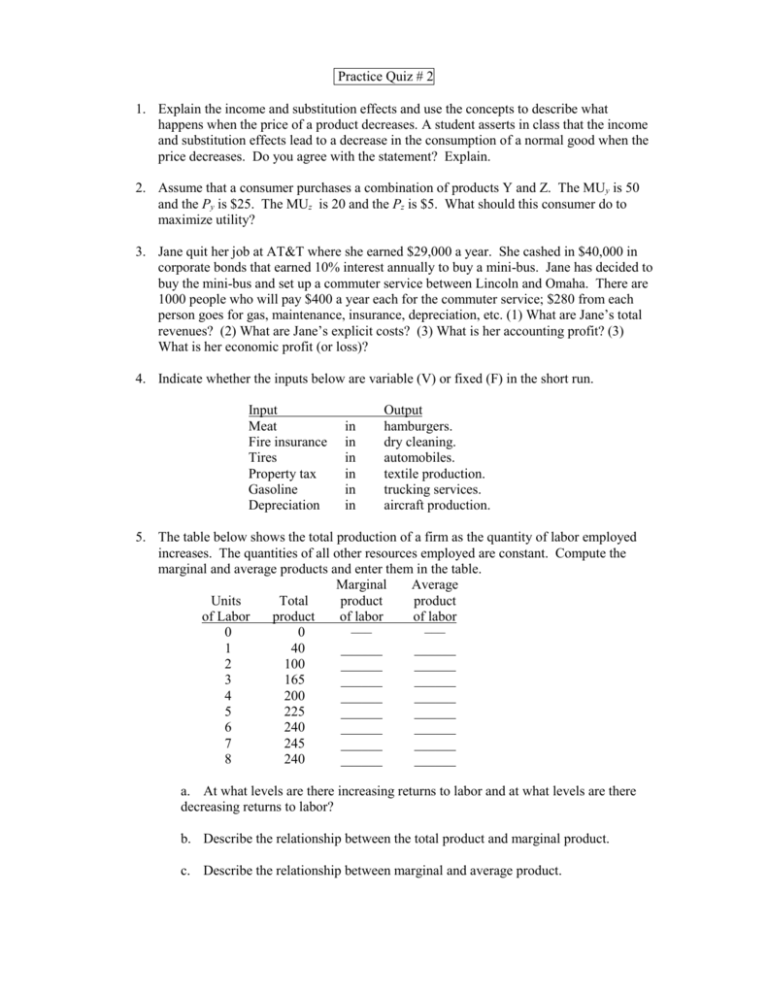
Practice Quiz # 2 1. Explain the income and substitution effects and use the concepts to describe what happens when the price of a product decreases. A student asserts in class that the income and substitution effects lead to a decrease in the consumption of a normal good when the price decreases. Do you agree with the statement? Explain. 2. Assume that a consumer purchases a combination of products Y and Z. The MUy is 50 and the Py is $25. The MUz is 20 and the Pz is $5. What should this consumer do to maximize utility? 3. Jane quit her job at AT&T where she earned $29,000 a year. She cashed in $40,000 in corporate bonds that earned 10% interest annually to buy a mini-bus. Jane has decided to buy the mini-bus and set up a commuter service between Lincoln and Omaha. There are 1000 people who will pay $400 a year each for the commuter service; $280 from each person goes for gas, maintenance, insurance, depreciation, etc. (1) What are Jane’s total revenues? (2) What are Jane’s explicit costs? (3) What is her accounting profit? (3) What is her economic profit (or loss)? 4. Indicate whether the inputs below are variable (V) or fixed (F) in the short run. Input Meat Fire insurance Tires Property tax Gasoline Depreciation in in in in in in Output hamburgers. dry cleaning. automobiles. textile production. trucking services. aircraft production. 5. The table below shows the total production of a firm as the quantity of labor employed increases. The quantities of all other resources employed are constant. Compute the marginal and average products and enter them in the table. Marginal Average Units Total product product of Labor product of labor of labor 0 0 ––– ––– 1 40 ______ ______ 2 100 ______ ______ 3 165 ______ ______ 4 200 ______ ______ 5 225 ______ ______ 6 240 ______ ______ 7 245 ______ ______ 8 240 ______ ______ a. At what levels are there increasing returns to labor and at what levels are there decreasing returns to labor? b. Describe the relationship between the total product and marginal product. c. Describe the relationship between marginal and average product. 6. In the table below you will find a schedule of a firm’s fixed cost and variable cost. Complete the table by computing total cost, average fixed cost, average variable cost, average total cost, and marginal cost. Total Total Average Average Average Total fixed variable Total fixed variable total Marginal product cost cost cost cost cost cost cost 0 $100 $ 0 $_____ ––– ––– ––– ––– 1 100 100 _____ $______ $______ $______ $_____ 2 100 180 _____ ______ ______ ______ _____ 3 100 240 _____ ______ ______ ______ _____ 4 100 320 _____ ______ ______ ______ _____ 5 100 440 _____ ______ ______ ______ _____ 6 100 600 _____ ______ ______ ______ _____ 7 100 800 _____ ______ ______ ______ _____ 8 100 1040 _____ ______ ______ ______ _____ 9 100 1340 _____ ______ ______ ______ _____ 10 100 1800 _____ ______ ______ ______ _____ 7. Answer the questions below on the basis of the diagram. : a. b. c. d. e. f. g. AVC at 6,000 units of output? ATC at 6,000 units of output? AFC at 6,000 units of output? TVC at 6,000 units of output? TFC at all levels of output? TC at 10,000 units of output? When diminishing returns set in? 8. What factors explain economies of scale and diseconomies of scale?


