Hardy-Weinberg Questions
advertisement
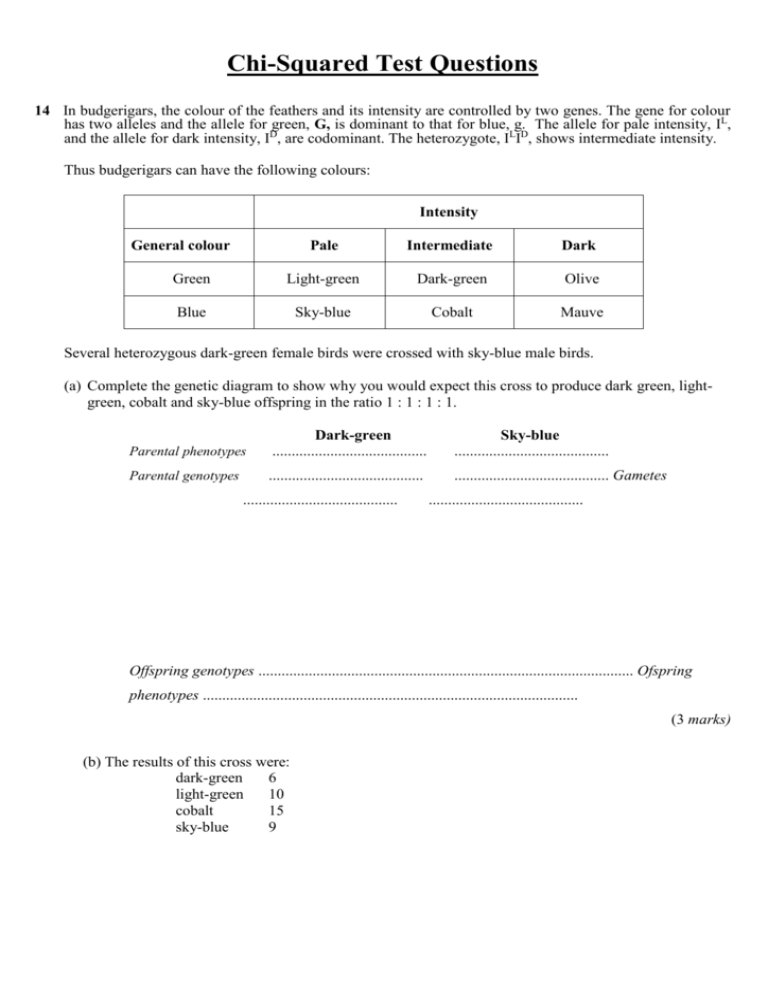
Chi-Squared Test Questions 14 In budgerigars, the colour of the feathers and its intensity are controlled by two genes. The gene for colour has two alleles and the allele for green, G, is dominant to that for blue, g. The allele for pale intensity, IL, and the allele for dark intensity, ID, are codominant. The heterozygote, ILID, shows intermediate intensity. Thus budgerigars can have the following colours: Intensity General colour Pale Intermediate Dark Green Light-green Dark-green Olive Blue Sky-blue Cobalt Mauve Several heterozygous dark-green female birds were crossed with sky-blue male birds. (a) Complete the genetic diagram to show why you would expect this cross to produce dark green, lightgreen, cobalt and sky-blue offspring in the ratio 1 : 1 : 1 : 1. Parental phenotypes Dark-green ........................................ Sky-blue ........................................ Parental genotypes ........................................ ........................................ Gametes ........................................ ........................................ Offspring genotypes ................................................................................................. Ofspring phenotypes ................................................................................................. (3 marks) (b) The results of this cross were: dark-green 6 light-green 10 cobalt 15 sky-blue 9 (i) The Chi-squared (χ 2) test was used to test whether the observed results fitted the expectation of a 1 : 1 : 1 : 1 ratio. Complete the table. Phenotype Number Number observed (O) expected (E) Dark-green 6 Light-green 10 Cobalt 15 Sky-blue Difference squared (O - E)2 Difference (O- E) 9 (2 marks) (ii) Calculate the value of χ 2 using the following formula: (O - E)2 χ 2=∑----------E Answer ......................................... (1 mark) (iii) Were the results significantly different from the expected 1 : 1 : 1 : 1 ratio? Use the 5% level of probability in the following χ 2 table to explain how you reached your answer. Probability (P) Degrees of freedom 0.90 0.50 0.20 0.10 0.05 0.02 0.01 1 0.02 0.46 1.64 2.71 3.84 5.41 6.64 2 0.21 1.39 3.22 4.61 5.99 7.82 9.21 3 0.58 2.37 4.64 6.25 7.82 9.84 11.34 4 1.06 3.36 5.99 7.78 9.49 11.67 13.28 5 1.61 4.35 7.29 9.24 11.07 13.39 15.09 .................................................................................................................................. .................................................................................................................................. (2 marks) . Soybeans are rich in protein. Raw soybeans, however, may contain a trypsin inhibitor. This is a chemical which prevents the digestion of protein. The presence of this trypsin inhibitor is genetically controlled. A single gene has alleles TA, TB and TC each of which codes for a different sort of trypsin inhibitor. These alleles are codominant so a plant with the genotype TATB will produce two sorts of trypsin inhibitor, inhibitor A and inhibitor B. A fourth, recessive allele, TO does not code for a trypsin inhibitor. This information is summarised in the table. Allele (c) TA Inhibitor produced A TB B TC C TO None The inheritance of trypsin inhibitors in soybeans is an example of multiple allele inheritance. Explain how multiple allele inheritance differs from polygenic inheritance. ........................................................................................................................................... ........................................................................................................................................... (1 mark) (d) (i) Give all the possible genotypes of a plant which only contains inhibitor A. ............................................................................................................................... (1 mark) (ii) Give all the possible genotypes of the gametes produced by a plant which contains inhibitors B and C. ............................................................................................................................... (1 mark) (e) Two soybean plants were crossed and the seeds collected and counted. The results are shown in the table. Inhibitors present in seed Number of seeds A and B 23 A 25 B 48 (i) Complete the genetic diagram to explain the results of this cross. Phenotypes of parents: ……………………… ………………………… Genotypes of parents: ................................... ………………………… Genotypes of gametes: ……………………… ………………………… Genotypes of offspring: ………………………………………………………. Phenotypes of offspring Inhibitor A Inhibitor A Inhibitor B and Inhibitor B (3 marks) (ii) A chi-squared test was applied to the data collected in this investigation. Explain why statistical tests such as the Chi-squared test should be carried out on data like these. ……………………………………………………………………………….. …………………………………………………………………………….… ………………………………………………………………………………… (2 marks) Hardy-Weinberg Questions 12. In the flour beetle, the allele for red body colour (R) is dominant to the allele for black body colour (r). (a) Complete the genetic diagram to show the result of a cross between a heterozygous red beetle and a black beetle. Parental phenotypes Red Black Parental genotypes ...................................... ……………………………. Gametes ....................................... ……………………………. Offspring genotypes ................................................................................................... Offspring phenotypes .................................................................................................. [2 marks] (b) A mixed culture of red beetles and black beetles was kept in a container in the laboratory under optimal breeding conditions. After one year, there were 149 red beetles and 84 black beetles in the container. (i) Several assumptions are made when using the Hardy-Weinberg equation. Give two of these. 1. ....................................................... ............................................. 2. …………………………………………………………………… ......................................................................... …………………. [2 marks] 1. The table shows the results from an ecological investigation of the organisms in one food chain from this food web. Mean mass of organism/g Population density/number m-2 Species Two-spot ladybird 0.027 21 Large nettle aphid 0.002 5420 Nettle plant 38.1 23 For this food chain, use the figures to help you to sketch the shape of: 1. the pyramid of numbers; 2. the pyramid of biomass. (2 marks) (c) The drawings in Figure 1 show two different varieties of the two-spot ladybird, the normal red form and a black form. These two varieties are determined by a single gene with the allele for black body, B, being dominant to that for red body, b. Black form Red form Figure 1 The bar chart shows the frequency of the allele for black body in autumn and spring samples over a number of years. 0.5 0.4 Key 0.3 Autumn 0.2 0.1 Spring 0 1929 1930 1931 (i) In the autumn 1929 sample, what was the frequency of: 1. the B allele; ………………………………………………………………………………………. 2. the b allele? ………………………………………………………………………………………… (1 mark) Use the Hardy-Weinberg expression to calculate the expected frequency in the autumn 1929 sample of: (ii) 1. ladybirds with the genotype Bb; ………………………………………………………………………………………… ………………………………………………………………………………………… ………………………………………………………………………………………… (2 marks) 2. black ladybirds. ………………………………………………………………………………………… ………………………………………………………………………………………… ………………………………………………………………………………………… (2 marks) Some information about the biology of two-spot ladybirds is given below. (d) The two-spot ladybird spends the winter as an adult. When the weather gets warmer it becomes active and starts to feed and breed. The temperature of the ladybird depends on that of its environment. The higher the temperature, the more active the ladybird. Temperature sensors placed under the wing cases showed that the black areas cool down and heat up faster than the red ones. Use this information to explain the seasonal changes in frequency of the B allele shown in the bar chart. ………………………………………………………………………………………… ………………………………………………………………………………………… ………………………………………………………………………………………… ………………………………………………………………………………………… ……………………………………………………………………………………… (4 marks) (e) Figure 2 shows a variety of ladybird which has very small wings and is unable to fly. "Wingless" ladybird Figure 2 Describe briefly how you could show that this condition is due to a single pair of alleles with the allele for wingless, w, recessive to that for normal wings, W. ………………………………………………………………………………………… ………………………………………………………………………………………… ………………………………………………………………………………………… ………………………………………………………………………………………… (2 marks) Inheritance – Genotype and Phenotype Questions 6. Night blindness is a condition in which affected people have difficulty seeing in dim light. The allele for night blindness, N, is dominant to the allele for normal vision, n. (These alleles are not on the sex chromosomes.) The diagram shows part of a family tree showing the inheritance of night blindness. Female with night blindness Male with night blindness O Female with normal sight ? 12 Male with normal sight 13 (a) Individual 12 is a boy. What is his phenotype? ………………………………………………………………………………………… (1 mark) (b) What is the genotype of individual 13? Explain the evidence for your answer. Genotype: ......................................................................................................................... Evidence: ........................................................................................................................………...... ........................................................................................................................................... ………………………………………………………………………………………… (2 marks) (c) What is the probability that the next child born to individuals 10 and 11 will be a girl with night blindness? Show your working. Probability:………………………………… [2 marks] 3. Cystic fibrosis is a condition in which affected people suffer from the accumulation of a thick, sticky mucus in their lungs. The diagram shows part of a family tree in which some individuals have cystic fibrosis. 1 3 7 2 4 5 8 6 9 10 Key Male with cystic fibrosis Female with Cystic Unaffected male Unaffected female Fibrosis (a) Explain the evidence from this family tree that cystic fibrosis is controlled by a recessive allele. ………………………………………………………………………………………………………………………………………. …………………………………………………………………………………………….……………………………………..…… ……………………………………………………………………………………………………………………………….……… (2 marks) (b) What is the probability that the next child born to individuals 3 and 4 would have at least one allele for cystic fibrosis? Explain your answer. ………………………………………………………………………………………………………………………………………… ……………………………………………………………………………………………………………………………….……… …………………………………………………………………………………………………………………………….………… (c) (2 marks) In Britain, 1 in 2000 people are born with cystic fibrosis. What is the frequency of the cystic fibrosis allele in the British population? …………………………………………………………………………………………….……………………………………..…… …………………………………………………………………………………………………………………………… (2 marks) Sex Inheritance Questions 16. The way in which sex is determined in birds is different from that in mammals. In birds, the male has two X chromosomes while the female has one X and one Y chromosome. In poultry, the gene for chick colour is sex linked and carried on the X chromosome. The allele for light colour is dominant to that for dark colour. (a) Complete the genetic diagram below to show the cross in which all the male chicks will be light coloured and all the female chicks will be dark coloured. Male (XX) Female (XY) Phenotype of parents: ..................................... ………………………. Genotype of parents: ..................................... ………………………. Gametes: ......................………... .................................... Genotype of chicks: ........................................................................ Phenotype of chicks: 1:1 Light-coloured male : Dark-coloured female; (3 marks) (b) Poultry farmers who keep hens for egg laying usually buy young chicks from a poultry breeder. Explain why sex linkage may be of practical use in poultry farming. ............................................................................................................................... ...............................................………………………………………………….. (1 mark) 3. In cats, one of the genes for coat colour is present only on the X chromosome. This gene has two alleles. The allele for ginger fur, XB, is dominant to that for black fur, Xb. (a) All the cells in the body of a female mammal carry two X chromosomes. During an early stage of development one of these becomes inactive and is not expressed. Therefore female mammals have patches of cells with one X chromosome expressed and patches of cells with the other X chromosome expressed. Tortoiseshell cats have coats with patches of ginger and patches of black fur. (i) What is the genotype of a tortoiseshell cat? ………………………………………………………………………… (1 mark) (ii) Explain why there are no male tortoiseshell cats. ………………………………………………………………………… (1 mark) (b) A cat breeder who wished to produce tortoiseshell cats crossed a black female cat with a ginger male. Complete the genetic diagram and predict the percentage of tortoiseshell kittens expected from this cross. Parental phenotypes: black female ginger male Parental genotypes: …………… …………... Gamete genotypes: …………… …………… Offspring genotypes: ………………………………………………………….. Percentage of tortoiseshell kittens: ……………………………………………. (3 marks) (c) The graphs show the range of heights of samples of two varieties of wheat grown under the same conditions. Variety A is a modern form and Variety B is a form that was commonly grown 100 years ago. 200 200 Number of 150 Plants Number of 150 Plants 100 100 50 50 50 (i) 100 150 Height / cm Variety A 50 100 150 Height / cm Variety B Name the type of variation shown in these two graphs. ........................................................................................................................................... . (1 mark) (ii) Describe two differences shown in the graphs between Variety A and B. 1. ................................................................................................................................... ................................................................................................................................... 2. ................................................................................................................................... ................................................................................................................................... (2 marks) (iii) Suggest how the differences between the two varieties could have been brought about. .......................................................................................................................................... ........................................................................................................................................... ........................................................................................................................................... ........................................................................................................................................... (2 marks) (iv) Suggest the advantages that these differences could have for modern farmers. ..................................................................... ……………………………………….. ..................................................................... ……………………………………...... ……………………………………………………………………………………… ……………………………………………………………………………………… (2marks) Assume that two genes affect the height of wheat plants and both of these genes have two alleles. The table gives a summary of some possible genotypes and phenotypes. Genotype Phenotype height of wheat/cm AABB 100 AaBb AAbb aabb 70 70 40 A wheat plant that was 100 cm tall was crossed with a wheat plant that was 40 cm tall, fertilisation occurred and the seeds were planted and grown. (d) Using only the information in the table, answer the following questions. (i) What are the genotypes of the gametes in this cross? …………………………… ………………………… (1 mark) (ii) What would be the expected genotype and phenotype of the resulting offspring? Genotype Phenotype ………………………… ………………………………….. (2 marks) (e) Not all of the offspring grew to their expected phenotypic height. Suggest why. ……………………………………………………………………………………………. ……………………………………………………………………………………………. ……………………………………………………………………………………………. (2 marks) The shells of C. nemora/is vary in the number of dark bands present. This is shown in the drawing. Variation in banding is controlled by two genes which are found on different chromosomes. One gene determines the presence or absence of banding with the allele for unbanded, B, dominant to the allele for banded, b. The second gene determines the number of bands present with the allele for one band, F, dominant to the allele for five bands, f. (c) Explain why snails with five bands have the genotype bbff. ………………………………………………………………………………………………. ………………………………………………………………………………………………. ………………………………………………………………………………………………. ………………………………………………………………………………………………. (2 marks) (d) A cross was carried out between two snails, heterozygous for both of these genes. Predict the proportion of the offspring from this cross that you would expect to have one band. Complete the genetic diagram to explain your answer. Genotype of parents: Gametes: Genotypes of offspring: Proportion of one-banded snails: (4 marks)


