Biometry – STAT 02.280 - Science 332
TR 9:25-10:40am (class), F 9:25am-12:05pm (lab)
Rowan University – Fall 2007
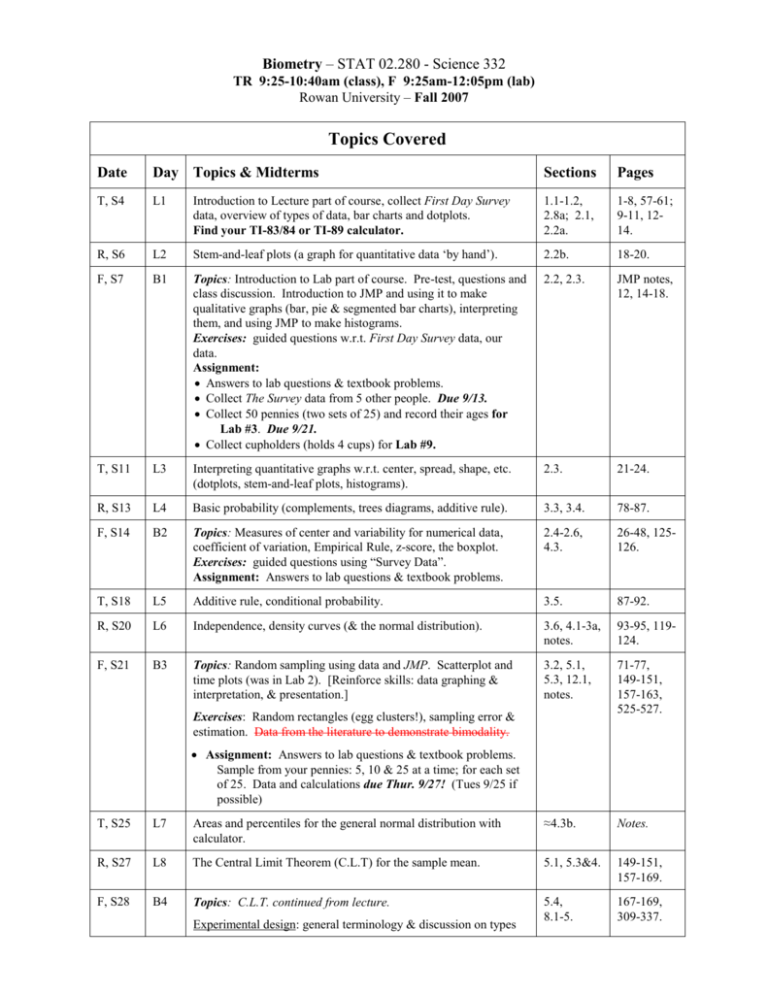
Topics Covered
Date
Day Topics & Midterms
Sections
Pages
T, S4
L1
Introduction to Lecture part of course, collect First Day Survey
data, overview of types of data, bar charts and dotplots.
Find your TI-83/84 or TI-89 calculator.
1.1-1.2,
2.8a; 2.1,
2.2a.
1-8, 57-61;
9-11, 1214.
R, S6
L2
Stem-and-leaf plots (a graph for quantitative data ‘by hand’).
2.2b.
18-20.
F, S7
B1
Topics: Introduction to Lab part of course. Pre-test, questions and
class discussion. Introduction to JMP and using it to make
qualitative graphs (bar, pie & segmented bar charts), interpreting
them, and using JMP to make histograms.
Exercises: guided questions w.r.t. First Day Survey data, our
data.
Assignment:
Answers to lab questions & textbook problems.
Collect The Survey data from 5 other people. Due 9/13.
Collect 50 pennies (two sets of 25) and record their ages for
Lab #3. Due 9/21.
Collect cupholders (holds 4 cups) for Lab #9.
2.2, 2.3.
JMP notes,
12, 14-18.
T, S11
L3
Interpreting quantitative graphs w.r.t. center, spread, shape, etc.
(dotplots, stem-and-leaf plots, histograms).
2.3.
21-24.
R, S13
L4
Basic probability (complements, trees diagrams, additive rule).
3.3, 3.4.
78-87.
F, S14
B2
Topics: Measures of center and variability for numerical data,
coefficient of variation, Empirical Rule, z-score, the boxplot.
Exercises: guided questions using “Survey Data”.
Assignment: Answers to lab questions & textbook problems.
2.4-2.6,
4.3.
26-48, 125126.
T, S18
L5
Additive rule, conditional probability.
3.5.
87-92.
R, S20
L6
Independence, density curves (& the normal distribution).
3.6, 4.1-3a,
notes.
93-95, 119124.
F, S21
B3
Topics: Random sampling using data and JMP. Scatterplot and
time plots (was in Lab 2). [Reinforce skills: data graphing &
interpretation, & presentation.]
3.2, 5.1,
5.3, 12.1,
notes.
71-77,
149-151,
157-163,
525-527.
Exercises: Random rectangles (egg clusters!), sampling error &
estimation. Data from the literature to demonstrate bimodality.
Assignment: Answers to lab questions & textbook problems.
Sample from your pennies: 5, 10 & 25 at a time; for each set
of 25. Data and calculations due Thur. 9/27! (Tues 9/25 if
possible)
T, S25
L7
Areas and percentiles for the general normal distribution with
calculator.
≈4.3b.
Notes.
R, S27
L8
The Central Limit Theorem (C.L.T) for the sample mean.
5.1, 5.3&4.
149-151,
157-169.
F, S28
B4
Topics: C.L.T. continued from lecture.
5.4,
8.1-5.
167-169,
309-337.
Experimental design: general terminology & discussion on types
of designs.
Exercises: Cents and the C.L.T. (ABS) continued; application of
C.L.T. to young tomato plants; recognizing experimental designs.
Assignment: Answers to lab questions, textbook problems, find a
research paper & discuss the experimental design.
T, O2
L9
Midterm Exam 1.
R, O4
L10
Confidence intervals (CIs) for a mean (for unknown s.d.).
6.1-6.3.
179-193.
F, O5
B5
Topics: Collecting and plotting data from different distributions
common in biology (including when you tend to find each kind of
distribution).
Notes.
Notes
Exercises: Variability and Natural Selection in Populations of
Wood Lice; collect data from outdoors related to trees and/or
seeds.
Distributions: Bernoulli, binomial, Poisson; uniform, normal,
lognormal, exponential.
Assignment:
Readings for next lab discussion (posted on Bb-CE/WebCT)
Collect 20 oak leaves for next lab.
Answers to lab questions.
T, O9
L11
CIs for a mean: finding the sample size for a given SE, conditions
for validity, testing for normality (& normal probability plot).
6.4-6.5,
4.4.
197-204,
133-139.
R, O11
L12
Sampling distribution for the sample proportion (exercise to
illustrate), CI for the population proportion, p …
5.2,
6.6.
151-155,
206-211.
F, O12
B6
Topics: One-sample t CIs for the population mean & population
proportion, finding sample sizes needed for the desired SE. Linear
transformations. Experimental design: random block designs &
and discussion of examples in the primary literature (see last lab).
6.2-6.4,
6.6, 2.7,
8.3-8.4.
185-198,
206-211,
50-55, 317332.
Exercises: Measurements on acorns.
Assignment:
Answers to lab questions & answers to questions about the reading
on block designs.
T, O16
L13
CI for p & finding the sample size for desired SE..
Testing for normality (& normal probability plot).
6.6, 4.4.
206-211,
133-139.
R, O18
L14
Hypothesis tests for the mean, developed with known s.d. (z-test)
Notes.
Notes.
F, O19
B7
Topics: Two-sample t-confidence intervals for the difference
between two means, with JMP. Concepts of hypotheses. Writing
formal biological lab reports.
7.1-7.3.
219-231.
Notes, 7.5.
252-254.
Notes,
7.4-7.
Notes, 234271.
10.1.
391-399.
Experimental design: discussion of confounding factors in data.
Exercise: Heart & pulmonary functions.
Assignment: Full lab report (due in two weeks).
T, O23
L15
… P-value, Type I and Type II error.
R, O25
L16
Midterm Exam 2.
F, O26
B8
Topics: One-sample t-tests and two-sample t-tests. P-values,
Type I and II errors.
Exercises: One-sample t-test, two-sample t-test: Dermatoglyphics.
Assignment: Answers to lab questions.
T, O30
L17
Chi-square test for goodness of fit (Poisson and penny ages)
& hypothesis test for one proportion (using chi-square g.o.f.).
R, N1
L18
Chi-square test for independence vs. homogeneity, and HT for two
population proportions.
10.2-10.3,
10.5.
402-419,
428-432.
F, N2
B9
Topics: Blocking in the paired design. The paired t-test.
Experimental design: recognition of confounding factors in
experiments.
9.1-9.3,
9.6-9.7.
8.2.
347-362,
377-384,
313-314.
Exercises: Ruler drop, thermochrons, set up duckweed (Lab 12).
Assignment:
Take home duckweed and begin daily data collection
Readings for next lab on WebCT
Answers to lab questions & textbook problems.
T, N6
No classes, Election Day
R, N8
L19
Confidence intervals for the difference between two population
proportions.
10.7.
439-440.
F, N9
B10
Topics: Chi-square tests (goodness of fit and tests of
independence). Fisher’s exact test (small sample size, doesn’t
meet assumptions).
10.1-10.5.
391-432.
Exercises: Pretest for next lab (on biomagnifications), collect data
on eye-color, Survey Data (e.g. favorite type of music vs. gender).
Assignment:
Continue collecting data from duckweed.
Answers to lab questions & textbook problems.
T, N13
L20
Scatterplots & Correlation.
12.1, notes,
12.5.
525-527,
555-560.
R, N15
L21
Least squares line and descriptive simple linear regression (SLR).
12.2-12.3.
527-547.
F, N16
B11
Topics: Interpretation of graphs in the primary literature;
biomagnification as an example. Scatterplots and line plots.
Notes.
12.1.
Notes.
Exercises: Biomagnification exercise.
Assignment:
Continue collecting data from duckweed.
Short write-up on biomagnification data & interpretation.
T, N20
L22
Midterm Exam 3
R, N22
No Classes, Thanksgiving vacation
F, N23
No Lab, Thanksgiving vacation
T, N27
L23
Inference in simple linear regression (slope, Y|X, Y|X).
12.4.
548-552.
R, N29
L24
One-way ANOVA.
11.1-11.4.
463-481.
F, N30
B12
Topics: One-way and/or two-way analysis of variance (ANOVA).
Graphs, analyzing, interpreting and presenting data and results,
verifying conditions.
11.1-11.6.
463-497.
≈11.8.
11.6.
Notes.
487-497.
Exercise: Duckweed. Point out this is actually blocked over
student (randomized block design).
Assignment: Full lab report on the duckweed experiment (due
Fri Dec 14).
T, D4
L25
Multiple comparisons: Tukey Kramer HSD.
Two-way ANOVA ...
R, D6
L26
… Two-way ANOVA.
Wilcoxon-Mann-Whitney test.
11.6.
7.11.
487-497,
288-296.
F, D7
B13
Topics: Nonparametric statistics: when these tests are necessary,
and when parametric statistics cannot be used. Wilcoxon-MannWhitney test & Kruskal-Wallis test.
Exercises: Wilcoxon-Mann-Whitney test on jumping frogs data
(ABS) and Kruskal-Wallis test on duckweed data.
Assignment:
Answers to lab questions.
7.11,
Notes.
288-296,
notes.
T, D11
L27
Kruskal-Wallis test & Student evaluations.
Notes.
Notes.
R, D13
L28
R2.
12.5.
553-555.
F, D14
B14
Topics: Review of hypothesis tests (HTs) covered in the course,
and constructing a flow chart for when to use which HT. Student
evaluations.
Exercises: Applying the flow chart to 3 situations.
Assignment: none.
T, D18
10:15am – 12:15am
Exam 4 & Replacement Exam (TBA)
Stat Instructor:
(≈ lectures)
Dex Whittinghill
Mathematics
Phone: (856) 256-4500 x3879
e-mail: whittinghill@rowan.edu
Office: ROB 228G
(2nd floor, Math Suite)
Bio Instructor:
(≈ labs)
Courtney Richmond
Biological Sciences
Phone: (856) 256-4500 x3555
e-mail: richmond@rowan.edu
Office: Science Hall 256D
Required Text:
Statistics for the Life Sciences, 3rd edition with CD-ROM. By Myra L. Samuels and Jeffrey
A. Witmer (2003). Pearson/Prentice Hall, Upper Saddle River, NJ. ISBN 0-13-243784-8.
This package includes the Student Solutions Manual by Jeffrey Witmer (2006) for free!
Overall Grading Scheme
Full Lab Reports (2 @ 15 & 25)
Other Lab Assignments (11 labs)
Lab total:
Lecture Attendance & Participation (LA&P) Grade
Homework
Exams 1, 2 & 3 @ 100 ea. (or a Replacement Exam?)
Fourth exam
Lecture total:
Grand Total
40 pts
110 pts
150pts
50pts
300pts
100pts
450 pts
600pts
6.7%
18.3%
25%
+/- 1%
8.3%
50.0%
16.7%
75%
100%
Target Grading Scale: A 90-100; B 80-89; C 70-79; D 60-69; F 59 and below. I also give ‘+’ and ‘–’.
Dex Whittinghill, Department of Mathematics, Rowan University, 201 Mullica Hill Rd., Glassboro, NJ 08028.
whittinghill@rowan.edu.

