Bean Lab
advertisement
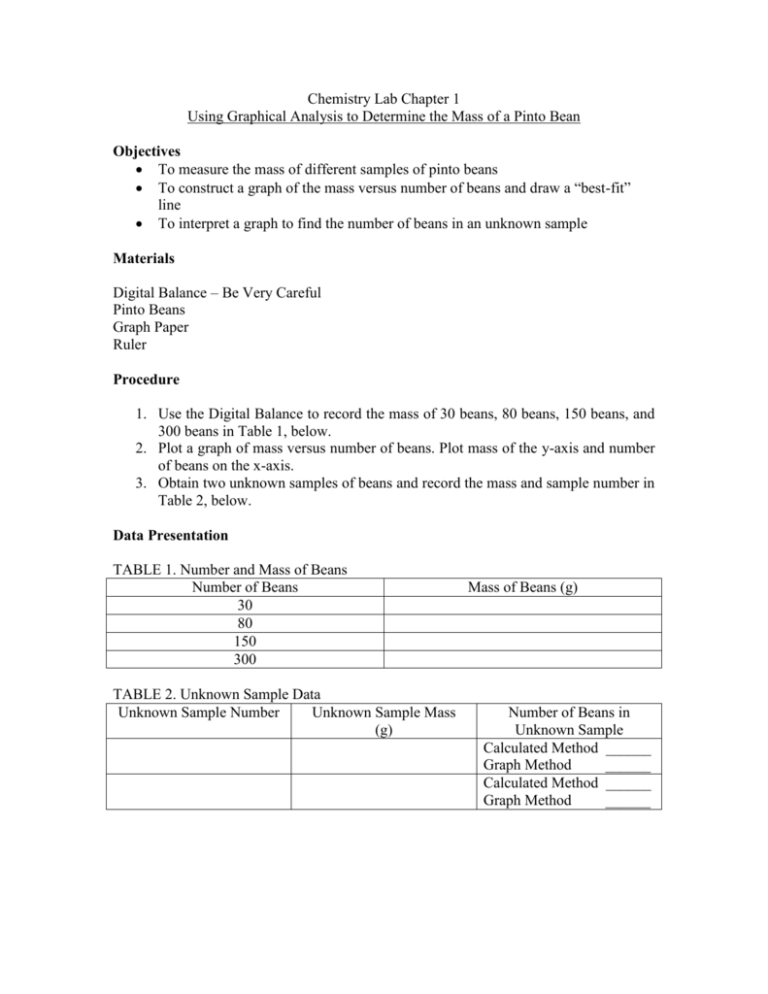
Chemistry Lab Chapter 1 Using Graphical Analysis to Determine the Mass of a Pinto Bean Objectives To measure the mass of different samples of pinto beans To construct a graph of the mass versus number of beans and draw a “best-fit” line To interpret a graph to find the number of beans in an unknown sample Materials Digital Balance – Be Very Careful Pinto Beans Graph Paper Ruler Procedure 1. Use the Digital Balance to record the mass of 30 beans, 80 beans, 150 beans, and 300 beans in Table 1, below. 2. Plot a graph of mass versus number of beans. Plot mass of the y-axis and number of beans on the x-axis. 3. Obtain two unknown samples of beans and record the mass and sample number in Table 2, below. Data Presentation TABLE 1. Number and Mass of Beans Number of Beans 30 80 150 300 TABLE 2. Unknown Sample Data Unknown Sample Number Unknown Sample Mass (g) Mass of Beans (g) Number of Beans in Unknown Sample Calculated Method ______ Graph Method ______ Calculated Method ______ Graph Method ______ Data Analysis 1. Using a ruler, draw a “best-fit” line for the graphed data points. Why should the line go through the origin? 2. Choose 2 points on the line and determine the slope of the line (Slope = y2 – y1/ x2 – x1) Show the work on the graph. 3. Using the slope determined in step 2 and the mass of the unknown samples, calculate the number of beans in the unknown samples. Use the formula (Slope = mass/number of beans) and record the answers in Table 2, above. 4. Determine the number of beans in the unknown samples graphically by locating the mass of the unknown sample on the axis, moving horizontally to the line, then vertically down to the x-axis. Record the number in Table 2, above. Conclusions 1. Give three reasons why the data points do not form a perfectly straight line. 2. Explain why you prefer the slope method from #3 or the graph method from #4 for determining the number of beans in the unknown sample. 3. Explain why the answers to questions 3 and 4 in the Data Analysis section should result in the same answer. Offer explanations for why they do not, if they do not. To turn in for this Lab 1. Typed report for following the Lab Report Format handout 2. Hand-drawn graph. Computer generated is acceptable, too. 3. Hand-written calculations from Data Analysis section #3. Computer generated is acceptable, too.

